Diagnose LCP with the Chrome DevTools Performance Panel
Record a throttled trace, read the four LCP sub-parts and find the phase that is costing you the most

This guide is part of the Largest Contentful Paint (LCP) hub. It covers one tool: the Chrome DevTools Performance panel. You will record a throttled trace, read the four LCP sub-parts, and walk away knowing which one to fix first.
Table of Contents!
DevTools comes last, not first
The Performance panel is a lab tool. It measures one page load, on one device, on one network: yours. That makes it the wrong place to start and the right place to finish.
Start with field data. CrUX tells you whether LCP is a problem at all. RUM data tells you which pages and which elements are slow for your real users. That workflow is covered step by step in Fix & Identify LCP Issues. DevTools then answers the only question left: why.
If you skip the field data, you end up optimizing the page you happen to test on the connection you happen to have. This is the pattern I see on almost every audit: the developer machine passes, the CrUX p75 fails, and everyone is confused. You measured a fast laptop on fiber. Your users are on a mid-range Android on a train.
The live metrics view
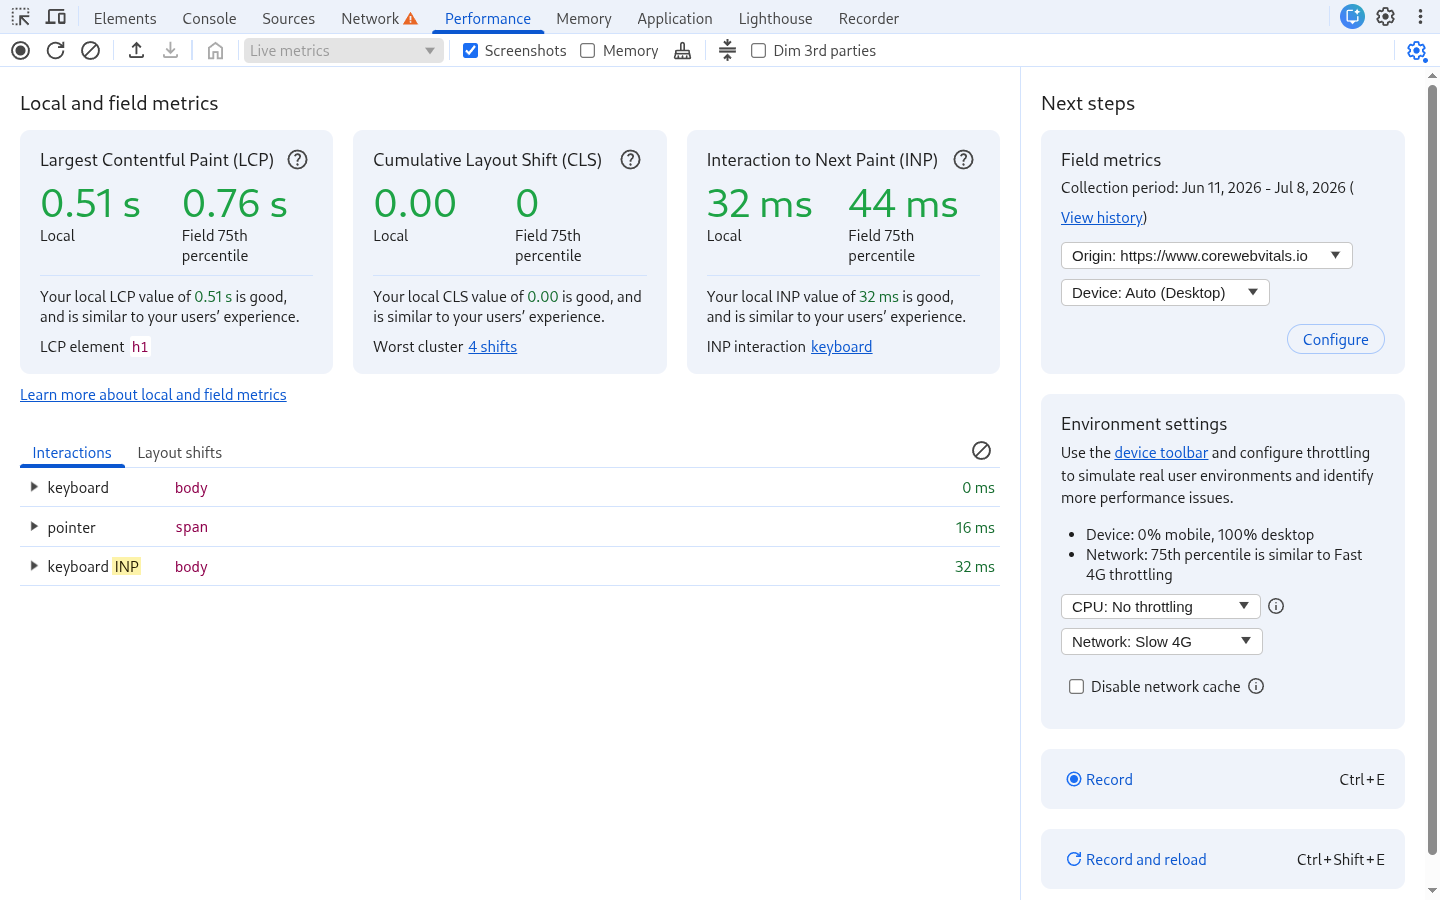
Open DevTools (Ctrl+Shift+I on Windows and Linux, Cmd+Option+I on Mac) and go to the Performance tab. The panel no longer opens empty. Before you record anything it shows a live metrics view with the LCP, CLS and INP of the page you are on, measured locally as you browse.
Three things in this view are useful for LCP work. First of all it names the LCP element, and hovering it highlights the element on the page. So there is no guessing which image or heading the browser picked. Also you can enable field data in this view. DevTools then pulls the CrUX numbers for the URL and origin and shows them next to your local values. If your local LCP reads 0.8 seconds and the field p75 reads 3.1 seconds, that gap is your first finding: your machine is not representative and throttling is not optional.
A quick tip: if you want the LCP element highlighted on any page without opening DevTools, use our free Core Web Vitals Visualizer Chrome extension.
Throttle before you record
An unthrottled trace on a developer machine is close to worthless. The numbers will be great and none of them will match what your users experience. Set both CPU and network throttling in the panel before recording.
- CPU throttling: use 4x slowdown as the default for mobile testing. 20x approximates a low-end device. Recent Chrome versions can also calibrate presets to your specific machine: the Calibrate option generates low-tier and mid-tier mobile presets based on how fast your own hardware is. That matters because 4x on a fast desktop is a very different device than 4x on an old laptop.
- Network throttling: use Slow 4G. This is the preset that used to be called Fast 3G before Chrome renamed it, and it is what Lighthouse simulates for mobile. Fast 4G is the lighter option for testing better connections.
When field data is enabled, DevTools can even recommend a throttling preset that matches what your real users experience. Use it. For the full reasoning behind these settings, see our guide on the best DevTools network settings for the Core Web Vitals.
Record a page load
Click the "Record and reload" button. Chrome navigates to a blank page, starts the trace, loads your page, and stops the recording on its own a couple of seconds after the load finishes. For LCP you do not need to touch anything during the recording. Keep your hands off the page.
A quick tip: record in an incognito window with extensions disabled. Extensions inject scripts into every page, and those scripts show up in your trace as long tasks that have nothing to do with your site.
Read the LCP breakdown insight
After the trace completes, the Insights sidebar on the left lists what DevTools found. The one you want is LCP breakdown (older Chrome versions call it LCP by phase). It splits the LCP time into its four sub-parts:
| Sub-part | What it measures | How to fix it |
|---|---|---|
| Time to First Byte | From the start of the navigation until the first byte of the HTML response arrives | Improve the TTFB |
| Resource load delay | From TTFB until the browser starts downloading the LCP resource | Optimize the Resource Load Delay |
| Resource load duration | The time spent downloading the LCP resource | Optimize the Resource Load Duration |
| Element render delay | From the moment the resource finishes downloading until the element is painted | Optimize the Element Render Delay |
For a text LCP without a webfont there is nothing to download, so the two resource sub-parts are zero and the whole story is TTFB plus render delay.
Hover a sub-part in the insight and DevTools highlights that exact window in the timeline. Click it and the timeline zooms in, so you can see which requests and tasks fall inside that window. And if you enabled field data, the insight shows the CrUX p75 value next to each lab sub-part (when CrUX has image LCP data for your site). That comparison is the most underrated feature in the panel. It tells you whether the trace you are staring at resembles what your users actually experience, before you spend an afternoon fixing it.
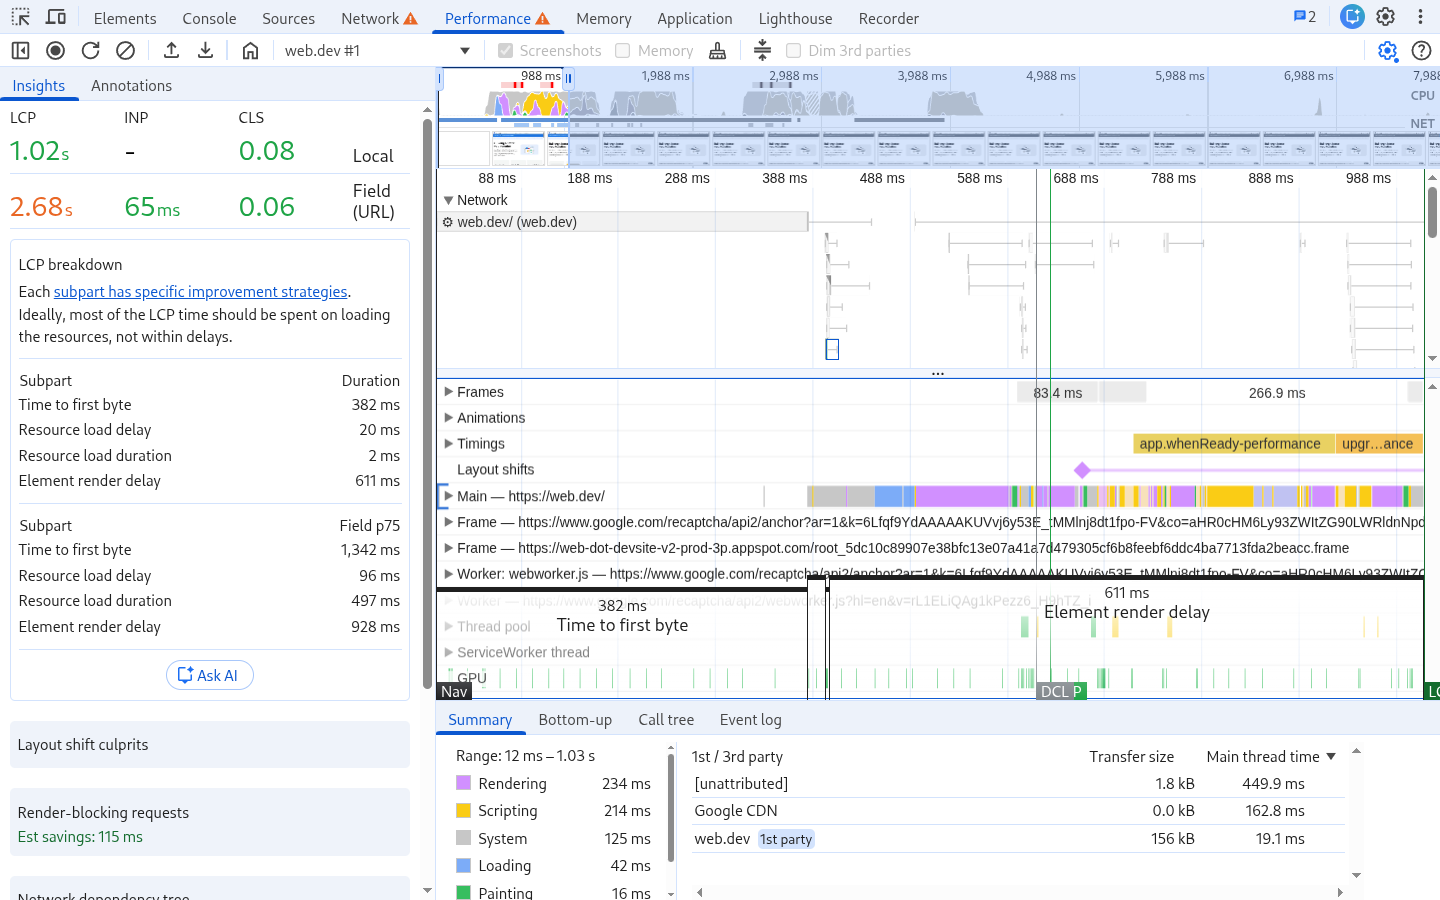
What should a healthy breakdown look like? Google's guidance is that the two delay sub-parts should be close to zero (under 10% of the LCP each), with nearly all the time going to TTFB and the actual download. Our own Core Web Vitals research across millions of page loads shows how far reality is from that: TTFB takes 48%, load delay 24%, load duration only 10% and render delay 17%. Read that again: on the median site, the two waiting phases together waste four times more time than the download itself. Nothing is downloading during those phases. Nothing is rendering either. The browser is waiting for work it could have started earlier, and that is why these two sub-parts are the first place to look for wins.
The LCP request discovery insight
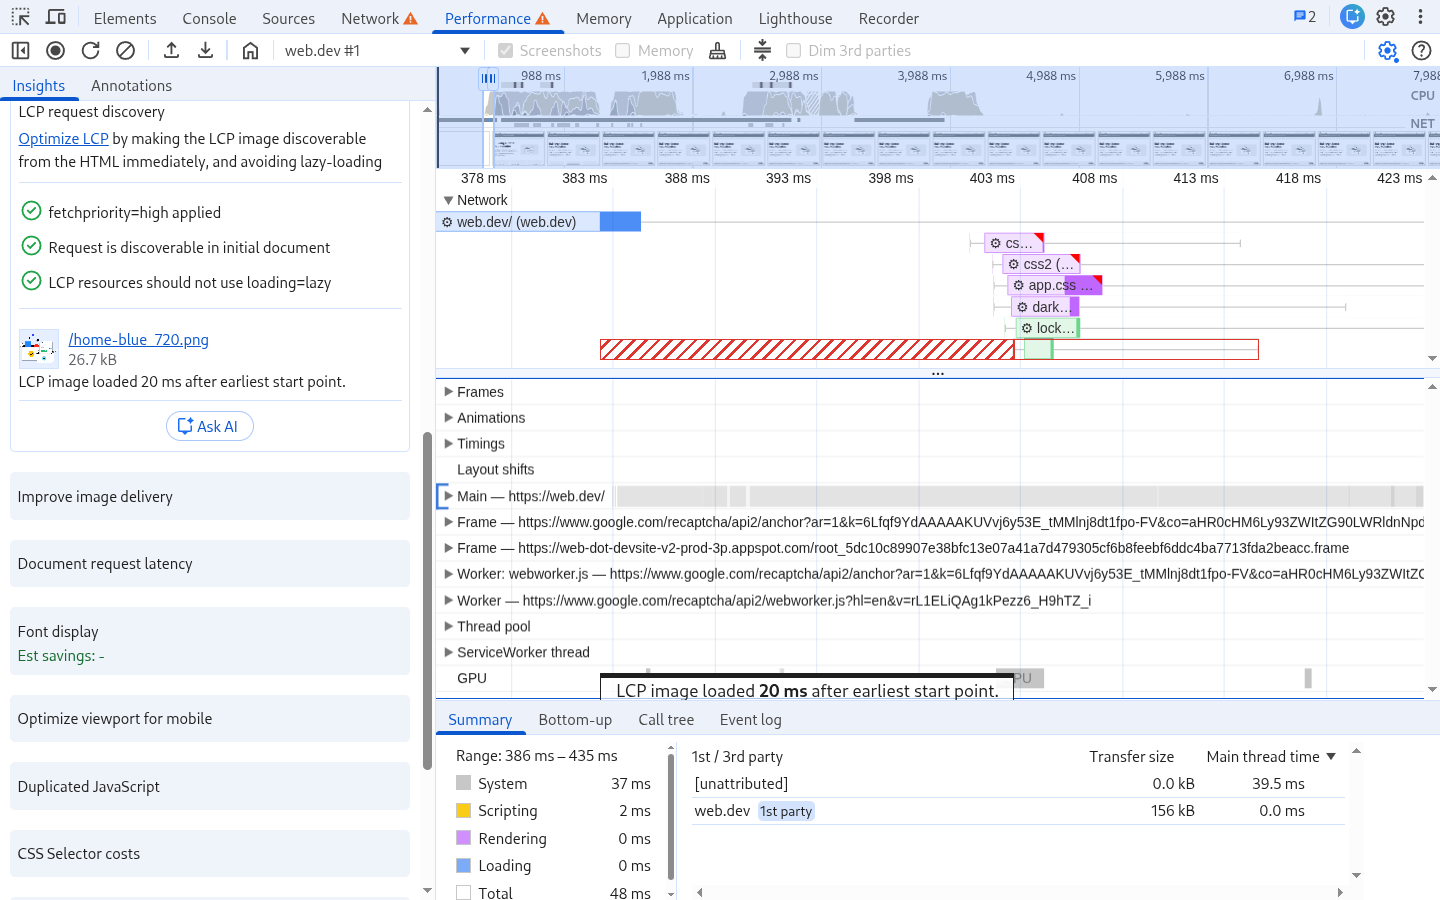
When the LCP is an image, there is a second insight worth opening: LCP request discovery. It runs three checks on the LCP request:
- Is
fetchpriority="high"applied to the image (or its preload)? - Is the request discoverable in the initial HTML document?
- Is lazy loading correctly not applied to it?
Any failed check points at a discovery problem. The insight also annotates the timeline with the moment the image could have started downloading and an estimate of the time you are losing. Each of these three failures has a concrete fix, and all of them are covered in the Resource Load Delay guide.
Reading the timeline yourself
The insights cover the common cases. For everything else you read the trace directly. Three tracks matter for LCP.
The Timings track shows markers for FCP, LCP, DCL and the load event. The LCP marker is the moment the element was painted. Everything you are diagnosing happens to the left of it.
The Network track shows every request. Find the LCP resource and look at when it starts, not just how long it takes. A request that starts at 2.5 seconds on a 3 second LCP is a discovery problem, and no amount of image compression will save it. If you had made that image discoverable from the first HTML bytes, the download would have started while the browser was still parsing the head.
The Main track shows main thread work. Long tasks are flagged with a red triangle in the corner. The pattern to look for: the LCP resource finished downloading, but the LCP marker sits hundreds of milliseconds further to the right. That gap is element render delay, and one of those flagged tasks usually owns it. Hover the task to see which script is responsible. In my experience it is a tag manager or a consent script far more often than it is your own code.
Fix what you found
The largest sub-part in the breakdown decides where you go next: TTFB, Resource Load Delay, Resource Load Duration or Element Render Delay. If the LCP element is an image, the Optimize the LCP Image guide cuts across all four.
One closing note: a prerendered page shows all four sub-parts at nearly zero, because the browser did all the work before the user clicked. If your LCP problem is on navigations within your site rather than on landing pages, speculation rules can skip the whole diagnosis.
I make sites pass Core Web Vitals.
500K+ pages for major European publishers and e-commerce platforms. I write the fixes and verify them with field data.
How I work
