INP Processing Time: Causes, Optimization, and Code Examples
Learn how to find and improve INP issues caused by processing time

Interaction to Next Paint (INP) issues caused by processing time
This page is part of our Interaction to Next Paint (INP) series. INP measures the total time from a user interaction to the next visual update. Processing time is the second of three phases that make up the INP, preceded by input delay and followed by presentation delay. If you are new to INP, read our guide on how to identify and fix INP issues first.
In short: The Interaction to Next Paint (INP) measures how long it takes for a user to see a visual change on a page after interacting with it. This INP can be broken down into 3 components: "input delay", "processing time", and "presentation delay".
Processing time is a major contributor to the total INP, accounting for roughly 40% of the delay on average. Optimizing your event handlers is the most direct way to reduce processing time and improve your INP score.
INP TIP: processing time can be optimized by immediately running important code that precedes the layout update and scheduling all other code to run after that.
Table of Contents!
- Interaction to Next Paint (INP) issues caused by processing time
- What is processing time?
- Processing time and the INP
- What causes high processing time?
- Minimize processing time
- Breaking up event handlers with setTimeout(0)
- Using requestAnimationFrame for visual updates
- How to prioritize critical code
- Fine-grained scheduling with scheduler.postTask()
- Practical implications
- Explore the other INP phases
What is processing time?
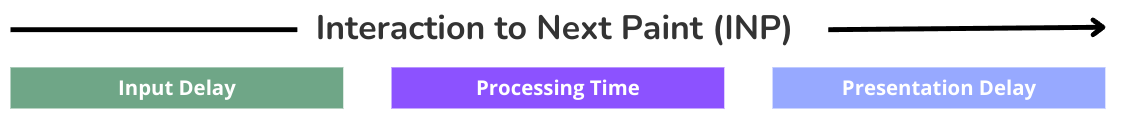
The Interaction to Next Paint (INP) can be broken down into 3 sub-parts: "Input Delay", "Processing Time", and "Presentation Delay".
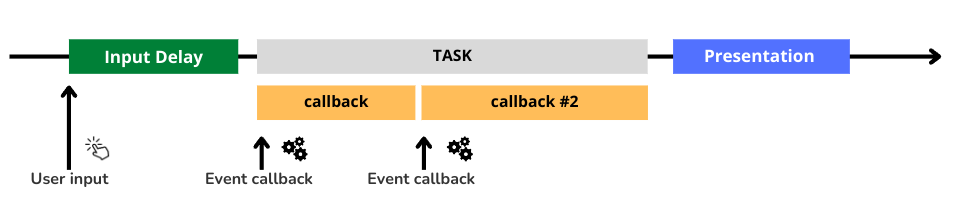
Processing time refers to the time it takes for the browser to execute all associated event callbacks after a user interacts with a web page (for example, clicking a button or pressing a key). While there is always some processing time, INP issues occur when the event callbacks take up too much processing time.
To put it simply: processing time is the duration of the "work" that happens in response to your interaction. When you click a search button, the processing time includes everything from validating your query, preparing the API request, updating local state, triggering analytics events, and any other code attached to that click event. Every line of JavaScript in those event handlers contributes to processing time.
Processing time and the INP
Processing time might be the first thing that comes to mind when you think about optimizing the Interaction to Next Paint. It is the "job that needs to be done" before the layout can be updated by the browser.
Many developers think about improving the INP in terms of optimizing callback functions (optimizing the processing time), and they are right. But in terms of importance, processing time is not even the single most important part to improve. It still, on average, makes up about 40% of the total INP time.
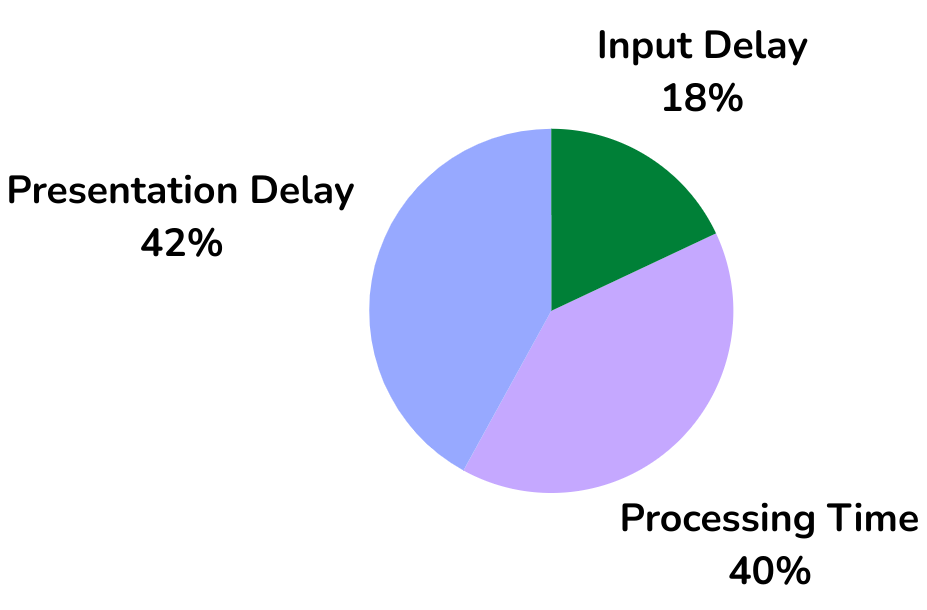
At CoreDash we collect millions of Core Web Vitals data points each hour. Based on that data, processing time accounts for 40% of the Interaction to Next Paint. 40% is a lot, but optimizing processing time alone will not fix INP issues. You should also look at input delay (18%) and presentation delay (42%).
Processing time example: When a user clicks a button to submit a form, the code that validates the form data, sends it to the server, and handles the response all contribute to processing time. The longer these operations take, the longer the processing time, and potentially the worse the INP score.
What causes high processing time?
High processing time has four common causes: unneeded code, unoptimized code, clustered callbacks, and layout thrashing.
- Unneeded code. Old, unused code or code without immediate relevance to the user interaction can prolong callback execution time. This includes analytics calls, logging, and state synchronization that does not need to complete before the next paint.
- Unoptimized code. Inefficient code (usually loops or inefficient DOM lookups) can make the event callbacks run slower than they need to. A common example is querying the DOM inside a loop with
document.querySelectorAll()instead of caching the result before the loop. - Clustered callbacks. Multiple event callbacks scheduled close together create a queue. If a callback triggered by the user interaction gets stuck in this queue, the response appears delayed. For example, a
pointerdownhandler, amousedownhandler, and aclickhandler may all fire sequentially for a single click. - Layout thrashing. Frequent DOM manipulations that trigger layout recalculations can strain the browser and lead to performance regressions. This happens when your code alternates between reading and writing layout properties inside a loop, forcing the browser to recalculate layout multiple times.
Minimize processing time
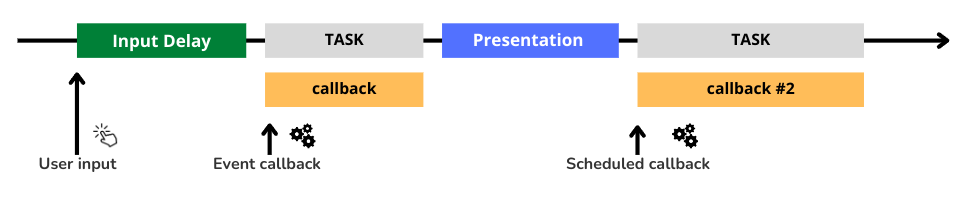
The strategy is twofold: optimize existing code (remove unneeded code and optimize the current code) and distinguish between code that needs to run before and after the layout update. Code that is critical to the layout update needs to run first, and all other code can run after the layout update.
- Remove unused code. While removing unused code might seem like a no-brainer, on most sites there is at least some old unused code that just executes without really adding anything to the page nor the UX. The first thing to do is ensure there is no code running that is not needed. This can be done by tree shaking, code splitting, inspecting your code coverage in Chrome, and by using a good IDE that will hint at unused code. (Pro tip: also take a critical look at resources loaded by your Tag Manager.) For more strategies, see our guide on 14 methods to defer JavaScript.
- Minimize callback execution time. Use a JavaScript profiler to identify bottlenecks in your code and target those areas for optimization. Consider techniques like memoization, pre-calculation, and caching to avoid redundant computations. (Tip: you can use the Chrome performance panel to find scripts with long execution time.)
- Prioritize critical code and schedule other code. When the callback code has been optimized, split the code into code that needs to run immediately and code that can be deferred. Take a look at this real-life example:
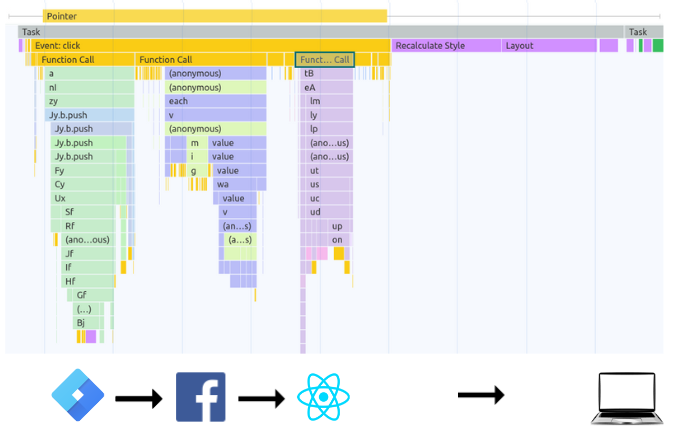
In this example, Google Tag Manager and Facebook event callbacks are executed before the (React) code that precedes the layout update. The solution is to schedule the GTM and Facebook callbacks to run when the browser is idle. - Avoid layout thrashing or reflow. Layout thrashing happens when style updates and style reads are mixed in a loop, causing the browser to recalculate the layout numerous times. To avoid layout thrashing, perform all style changes (the "sets") before requesting style values (the "gets"). This approach minimizes the frequency of layout updates, leading to a faster page. For instance, in a loop that sets each paragraph's width to match an element's width, read the element's width once before the loop and use that value to update the paragraphs' widths inside the loop.
Breaking up event handlers with setTimeout(0)
When you cannot remove or defer code from an event handler, the next best option is to break the handler into smaller chunks. The setTimeout(callback, 0) pattern allows you to split work across multiple tasks, giving the browser a chance to handle the layout update between them. Here is a practical example:
// Before: one long event handler blocks the next paint
button.addEventListener('click', () => {
  updateUI();           // Critical: must run before paint
  validateForm();       // Important but can wait
  sendAnalytics();      // Non-critical
  syncLocalStorage();   // Non-critical
});

// After: break into critical and deferred work
button.addEventListener('click', () => {
  updateUI();  // Critical: runs immediately before paint

  setTimeout(() => {
    validateForm();
  }, 0);

  setTimeout(() => {
    sendAnalytics();
    syncLocalStorage();
  }, 0);
});
The downside of setTimeout(0) is that it places the continuation at the end of the task queue. If other tasks are already queued, the deferred code may not run immediately. For more predictable behavior, use scheduler.yield() instead (see the section below). For patterns that specifically target JavaScript scroll handling, see our dedicated guide.
Using requestAnimationFrame for visual updates
When your event handler needs to trigger a visual update, requestAnimationFrame() ensures that your code runs at the optimal time: right before the browser performs its next repaint. This is especially useful when you need to batch DOM reads and writes to avoid layout thrashing.
// Use requestAnimationFrame to batch visual updates
button.addEventListener('click', () => {
  // Read layout properties first (outside rAF)
  const containerWidth = container.offsetWidth;

  requestAnimationFrame(() => {
    // Write layout properties inside rAF
    items.forEach(item => {
      item.style.width = containerWidth + 'px';
    });
  });

  // Schedule non-visual work for idle time
  requestIdleCallback(() => {
    trackButtonClick();
    updateSessionState();
  });
});
This pattern separates DOM reads from DOM writes, preventing forced synchronous layout. The visual update runs at the ideal time in the browser's rendering pipeline, and non-visual work runs during idle time.
How to prioritize critical code
"Prioritize critical code and schedule other code" sounds abstract, so here is what it looks like in practice. We can prioritize critical code by using requestIdleCallback() and by yielding to the main thread.
We use requestIdleCallback for less important tasks that do not need to run immediately. Here is a before and after example of scheduling a GTM event:
/* before: immediately run code */
gtag('event', '<event_name>', {
   'event_category': '<event_category>',
 });

/* after: run the same code during browser idle */
requestIdleCallback(() => {
  gtag('event', '<event_name>', {
    'event_category': '<event_category>',
  });
}, { timeout: 1000 });
The downside of requestIdleCallback is that code might not run as soon as you would like. In that case, you can "yield to the main thread" after the most important code has run, giving the browser a moment to perform the layout update. Here is an example of how to break up tasks by yielding to the main thread:
async function yieldToMain() {
  if ('scheduler' in window && 'yield' in window.scheduler) {
    return await window.scheduler.yield();
  }
  return new Promise((resolve) => {
    setTimeout(resolve, 0);
  });
}

async function handleClick() {
  // Do the most important layout updates here
  await yieldToMain();
  // Do other tasks that need to run as soon as possible after the layout update
}
Fine-grained scheduling with scheduler.postTask()
The scheduler.postTask() function provides finer-grained scheduling of tasks by setting priorities, which helps the browser prioritize work so that low-priority tasks yield to the main thread. Check the browser support table before using this API in production.
The postTask() function accepts three priority settings: "background" for the lowest priority tasks, "user-visible" for medium-priority tasks, and "user-blocking" for critical tasks requiring high priority.
By assigning the right priority to each piece of work inside your event handler, you can ensure that the browser handles user interactions responsively while still completing all necessary tasks:
// Schedule critical UI work at high priority
scheduler.postTask(() => {
  updateCartBadge();
  showConfirmation();
}, { priority: 'user-blocking' });

// Schedule data sync at medium priority
scheduler.postTask(() => {
  syncCartWithServer();
}, { priority: 'user-visible' });

// Schedule analytics at low priority
scheduler.postTask(() => {
  gtag('event', 'add_to_cart', { item: productId });
  fbq('track', 'AddToCart');
}, { priority: 'background' });
Practical implications
Here is how to approach processing time optimization on WordPress and React/Next.js.
WordPress
WordPress offers limited control when it comes to third-party scripts. Many scripts are added through plugins. Most of the time those scripts will add event listeners to the page that do not do anything except delay the Interaction to Next Paint (INP). If your WordPress site is having issues with the INP caused by long processing time, take the following steps:
- Check the theme settings. Uncheck any unneeded options like "smooth scroll" or "animated menu." Settings like these tend to cause INP issues.
- Check which scripts are responsible for the long processing time (tip: use the Chrome performance panel). If those scripts are plugin-related, consider finding another plugin that does roughly the same thing with less JavaScript.
- Oftentimes there are custom scripts running on the page. Check those scripts and make sure that they yield to the main thread often and wrap less important callbacks in a
requestIdleCallbackfunction. - Unload unused scripts on a per-page basis (tip: use
wp_deregister_script). Some plugins tend to inject scripts on every page even when the functionality is not needed. - Check your Tag Manager and remove unused or unneeded tags.
- Use lean and clean themes. Multipurpose themes that "do everything" tend to have more scripts and heavier event handlers.
- Avoid page builders since they often rely heavily on JavaScript for presenting pages to the end user.
React / Next.js
React's hooks and concurrency features make it possible to reduce INP processing time considerably. Here are the key techniques:
Prioritize user interaction with React concurrency features:
React 18 introduced concurrency features that optimize rendering for a smoother user experience, especially during input.
useTransitionandstartTransition: Mark non-critical updates for later rendering. This prevents large updates from blocking user interaction. For example, wrap a search results update instartTransitionso that typing in the search box remains responsive.useDeferredValue: Split your UI into essential and less-critical sections. React can interrupt rendering of the less-critical parts for a more responsive experience. This is ideal for rendering filtered lists or search results.useOptimistic(React 19+): Show a temporary, optimistic state while asynchronous operations (like network requests) are ongoing. This keeps the UI responsive even during data fetching.
Suspense for data fetching (React 18+)
Suspense in React 18 can be used to improve INP by allowing the browser to prioritize user interactions and optimize rendering. While React 16 introduced Suspense for code splitting, React 18 extends this functionality to encompass data fetching.
- A fallback component, like a loading indicator, displays while data loads.
- Once data arrives, React resumes rendering the suspended component.
- Suspense, combined with interruptible rendering in Concurrent React, prioritizes user interactions. If a user interacts with a suspended component, React prioritizes rendering that component, maintaining responsiveness.
These features help React prioritize user interactions over background rendering work.
Explore the other INP phases
Processing time is just one part of the Interaction to Next Paint. To fully optimize your INP scores, you should also address the other two phases:
- Input Delay: Minimize the waiting time before event handlers begin executing. Input delay accounts for approximately 18% of total INP time.
- Presentation Delay: Reduce the rendering and painting work that accounts for approximately 42% of total INP time.
For a complete diagnostic workflow, see our guide on how to find and fix INP issues, and return to the INP hub page for the full overview.
I built CoreDash for my own audits.
Under 1KB. EU hosted. No consent banner. Now with MCP support.
Try CoreDash free
