Core Web Vitals Visualizer: Free Chrome Extension for Debugging CWV
A free Chrome extension that creates a real-time overlay of your Core Web Vitals, built for developers who debug performance without opening DevTools.

A free Chrome extension for debugging Core Web Vitals
The Core Web Vitals Visualizer is a free Chrome extension I built to debug Core Web Vitals without opening DevTools. It creates a real-time overlay on any page, showing you exactly which elements affect your LCP, CLS, and INP. Over 14,000 developers use it.
Last reviewed by Arjen Karel on March 2026
As a Core Web Vitals specialist I spend a lot of time checking how a page reacts and responds when I interact with it. What does that do to the Core Web Vitals and how do the metrics change when I switch to mobile emulation or disable browser caching?
Sure I use RUM tracking. That tells me on a page level which metrics pass and fail. But why do they fail? That is something you can really only figure out when you interact with the page.
To save myself a lot of time I decided to automate a small part of a lengthy process and create a Chrome extension that does some of the tedious work for me. The result is the Core Web Vitals Visualizer. I decided to make it available for everyone, so go ahead and check it out on the Chrome Web Store.
What does the Core Web Vitals Visualizer do?
First it records the Core Web Vitals based on your interaction with the page. It tracks the Largest Contentful Paint, the Interaction to Next Paint, the Cumulative Layout Shift, the First Contentful Paint, and the Time to First Byte.
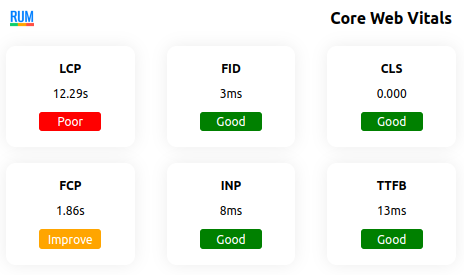
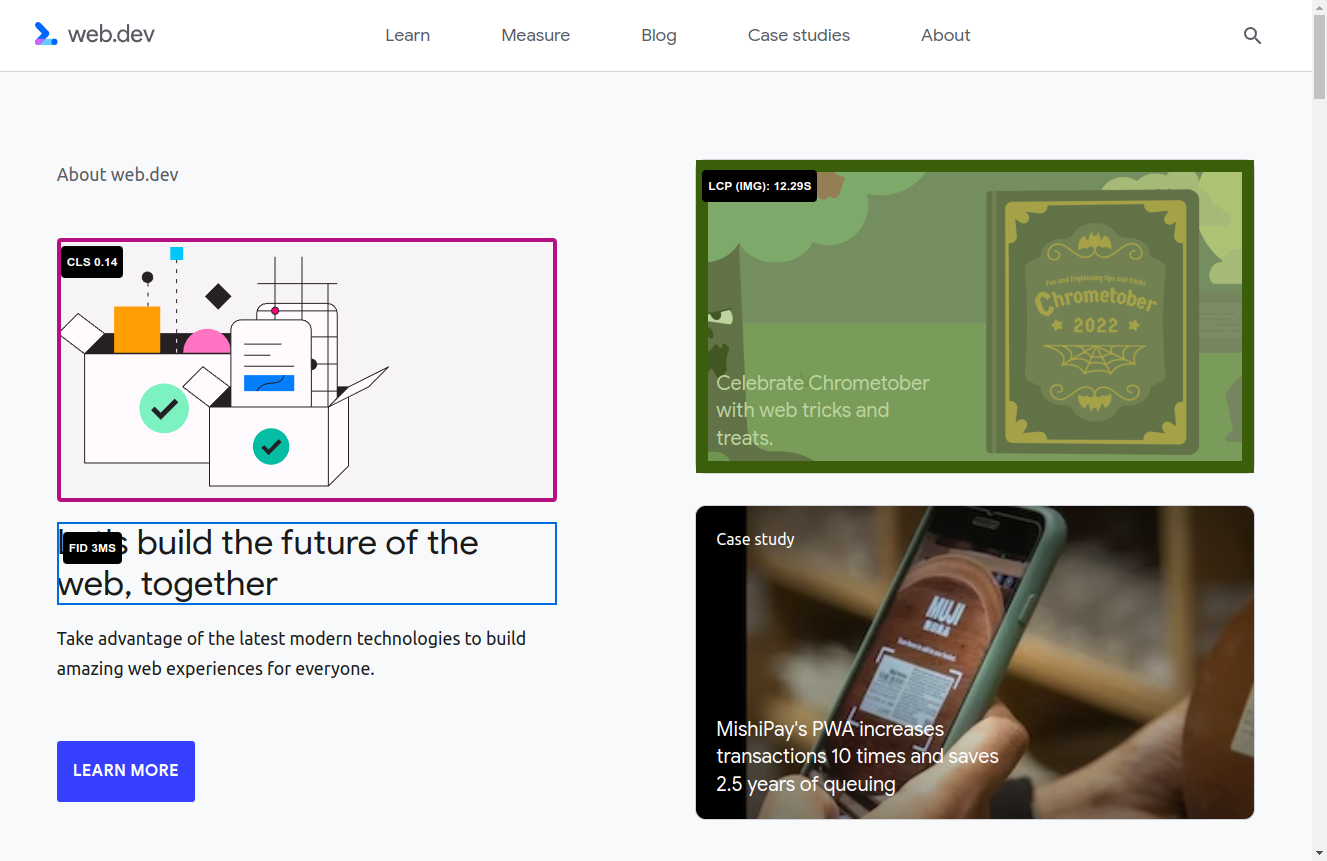
Next it creates an overlay that visualizes all those metrics. This tells you what element the Largest Contentful Paint is, which elements cause visual instability, and if you have interacted with the page, which event caused the worst input delay.
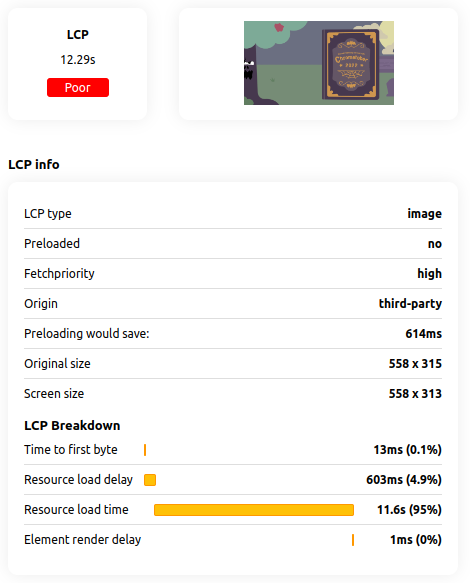
When you click on any of the metrics the Core Web Vitals Visualizer breaks them down into their most basic components. For LCP that means you see the resource load delay, load duration, and element render delay. For INP you get the input delay, processing time, and presentation delay.
Why not use Lighthouse?
I get this question a lot. My answer is always: "I never said I do not use Lighthouse" (although I do not use Lighthouse that often). Lighthouse is a great tool and you should get familiar with it.
But there are important differences. Lighthouse is a lab test and the data might not be representative of real life. That is why my extension uses your browser's real data. Lighthouse also does not give you real interaction results. It cannot measure INP because there is no real user interacting with the page. It uses Total Blocking Time as a proxy instead. My extension visualizes the actual CLS as it happens, and breaks down the LCP and INP into their sub-parts so you can see exactly where the time goes.
What about Google's Web Vitals extension?
Google deprecated their Web Vitals Chrome extension in January 2025. They now recommend using the DevTools Performance panel instead. DevTools is powerful, but sometimes you just want a quick overlay without opening a full profiling session. That is exactly what the Core Web Vitals Visualizer does. It also provides the metric sub-part breakdowns that DevTools does not show in a single view.
Install the Core Web Vitals Visualizer
Head to the Chrome Web Store and install the Core Web Vitals Visualizer. And just maybe, if you like it, leave a review. I would appreciate that.
I make sites pass Core Web Vitals.
500K+ pages for major European publishers and e-commerce platforms. I write the fixes and verify them with field data.
How I work
