Why the Core Web Vitals 28 day delay is a myth
The CrUX data is two days old, not 28. Here is what the 28-day rolling window actually means.

Debunking the Core Web Vitals 28-Day Delay Myth
I hear it all the time: "We deployed the fix, now we have to wait 28 days to see if it worked." This is wrong. The data is not 28 days old. It is about two days old. The confusion comes from how Google calculates the numbers, and once you understand that, the 28-day panic goes away.
Last reviewed by Arjen Karel on March 2026
CrUX data is two days old, not 28
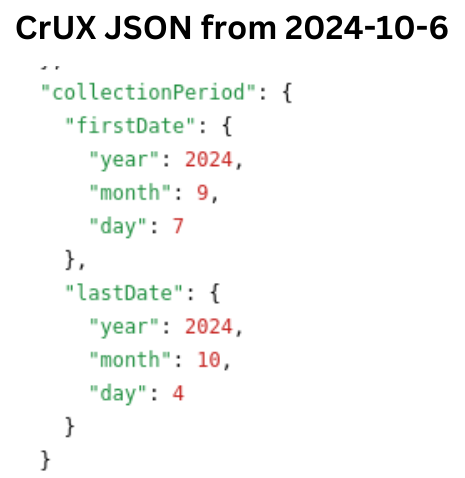
The Chrome User Experience Report (CrUX) updates daily around 04:00 UTC. When you query the CrUX API, the response includes a collectionPeriod field that shows the exact date range. The end date is typically yesterday or the day before. Since December 2024, PageSpeed Insights displays these dates too, so you can see for yourself.
So where does the 28 days come from?
What you see in PageSpeed Insights is the 75th percentile calculated over the last 28 days of real user data. Google uses a 28-day rolling window, not because they want to delay your data, but because it smooths out noise. A single bad day does not tank your score. A single good day does not save it. The window gives you a stable, representative picture of how real users experience your site.
Every day, the oldest day's data drops off and the newest day's data is added. There is no delay. The window just moves forward, one day at a time.
One thing many people get wrong: this is a 75th percentile, not an average. Several popular guides (including Vercel's) incorrectly call it an average. The distinction matters. A p75 means 75% of user experiences are at or below this value. It is more resistant to change than an average because outliers on the fast side do not pull it down as quickly.
Why improvements seem slow
When you deploy a performance fix, your new data gets mixed in with up to 27 days of old data. The 75th percentile shifts gradually, not overnight.
Think of it like this: You have a box of 28 red marbles. Every day you take out one old red marble and replace it with a new green marble. It will take a full 28 days to fully refresh the entire box, but there never was any delay!
How quickly the box becomes mostly green (the 75th percentile shifts) depends on how many red marbles were already in it. If your site was consistently slow, there are a lot of red marbles to replace. If it was borderline, the box turns green much faster.
What to expect after deploying a fix
Here is a realistic timeline of what happens after you deploy a performance improvement:
- Day 0: You deploy the fix. Nothing changes in CrUX yet.
- Day 2-3: The first improved data points enter the 28-day window. If you monitor closely, tiny shifts may appear.
- Day 7: About a quarter of the window contains post-fix data. Trends start becoming visible in the CrUX History.
- Day 14: Half the window is new data. If your fix was significant (say, LCP dropping from 4s to 2s), the p75 will have moved noticeably.
- Day 28: The window is fully refreshed. CrUX now reflects your current performance.
How dramatic the shift is depends on three things: how big the improvement was, how much traffic your site gets (more traffic means more new data points per day), and how consistent the fix is across all page loads.
Three places, three update speeds
Not all CrUX data updates at the same pace. This is another source of confusion:
- CrUX API and PageSpeed Insights: updated daily (~2-day lag). This is what most people use.
- CrUX History API: updated weekly on Mondays, with data through the previous Saturday. Powers the CrUX History tool and trend charts.
- CrUX BigQuery: updated monthly, on the second Tuesday after the collection period ends. If you only check BigQuery, it really can feel like a month-long delay.
If you are waiting impatiently for your numbers to move, check PageSpeed Insights (daily), not BigQuery (monthly).
Do not wait 28 days. Use RUM.
CrUX is Google's data. It tells you how Google sees your site. But you do not have to sit and wait for it. With Real User Monitoring you can track the Core Web Vitals on a per-day or even per-page-load basis. You will know within hours whether your fix is working, not days.
CrUX currently tracks 18.56 million origins with a 55.8% Core Web Vitals pass rate. If your site is among the 44% that still does not pass, do not let the "28-day delay" myth stop you from making changes. The data is almost real-time. The window just smooths it.
Performance degrades the moment you stop watching.
I set up the monitoring, the budgets, and the processes. That is the difference between a fix and a solution.
Let's talk
