Chrome DevTools Network Panel Settings for Core Web Vitals
The Network panel settings I use on every Core Web Vitals audit

The Chrome DevTools Network panel is one of the most useful tools for debugging the Core Web Vitals. But the default settings hide half the information you need. Here is how I configure the Network panel on every audit.
Last reviewed by Arjen Karel on March 2026
Table of Contents!
Configuring the Network Panel
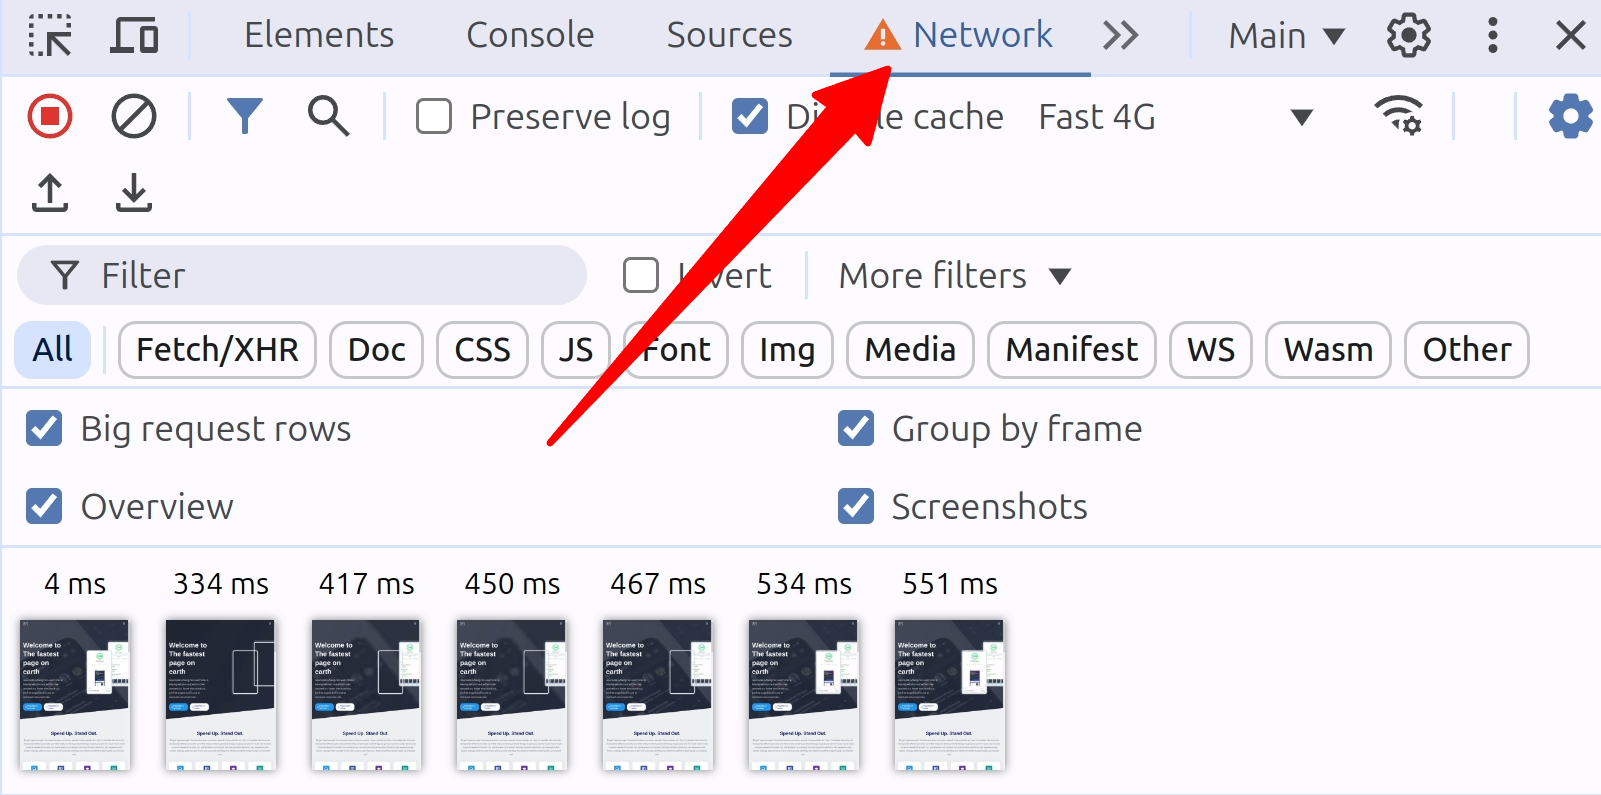
To access the Network panel, open Chrome DevTools (F12 or Ctrl+Shift+I) and click on the "Network" tab.
Throttling
Your visitors are not on your office Wi-Fi. Globally, 30% of mobile connections are still on 3G and another 55% are on 4G (GSMA Mobile Economy 2025). Network throttling lets you see what they see.
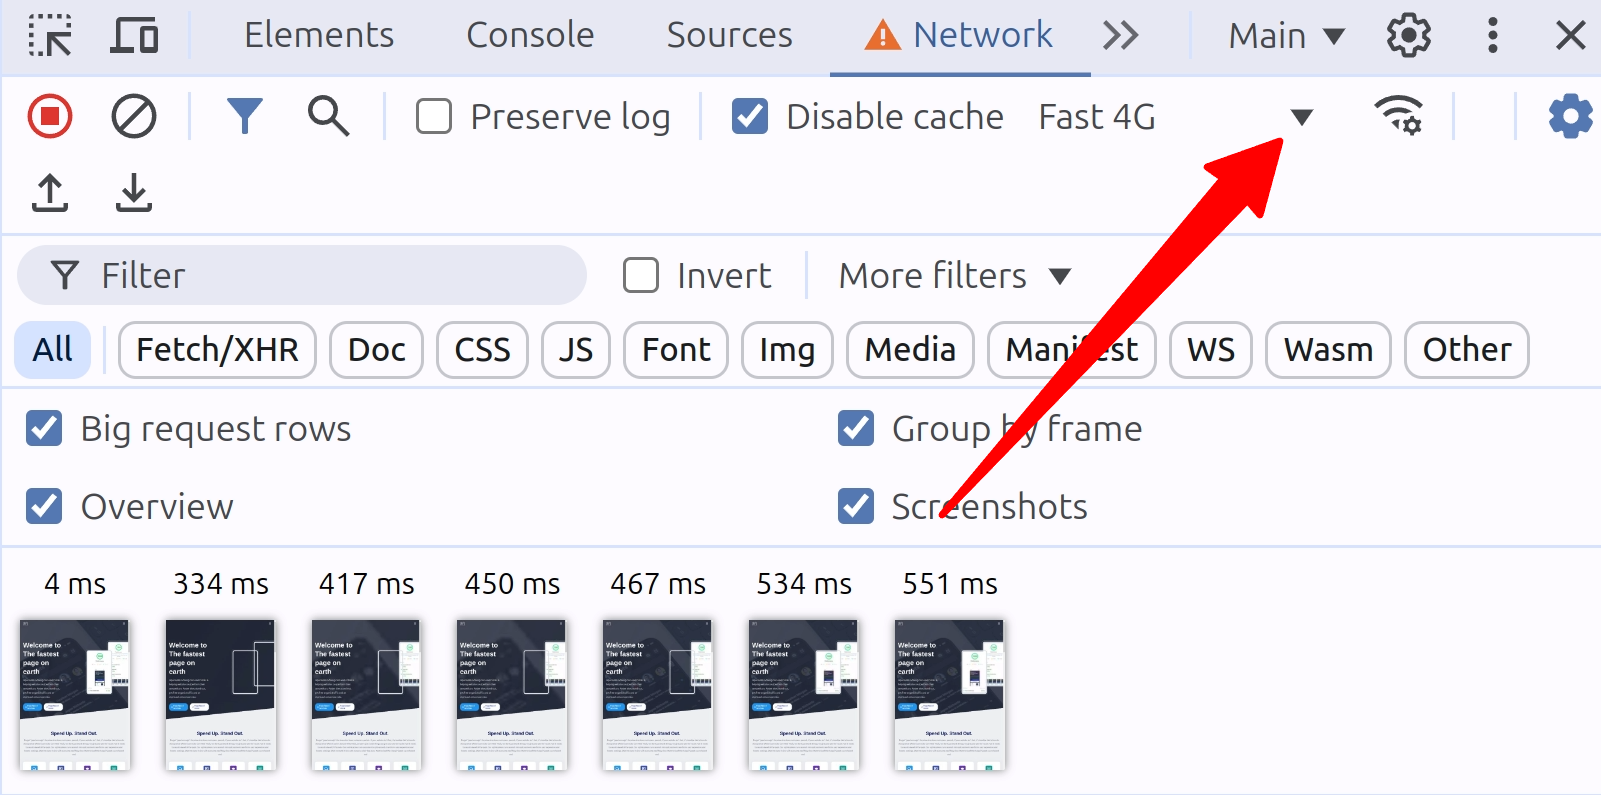
Click on the "No throttling" drop-down in the Network panel. Select "Fast 4G", "Slow 4G" or "3G" to simulate mobile network conditions. The best option depends on your audience. If your audience typically uses high end mobile devices under fast network conditions, enable "Fast 4G". If the typical network conditions are somewhat poorer, select "Slow 4G". Otherwise play it safe and select "3G".
Throttle individual requests (Chrome 145+)
Since December 2025, you can throttle a single request instead of the entire page. Right-click any request in the Network panel and select "Throttle request." This lets you answer questions like: what happens to my LCP if this third-party script loads slowly? Or: how does my page behave when the CDN is slow but the user's connection is fast? It is the fastest way to isolate the performance impact of a single resource.
Disable Cache
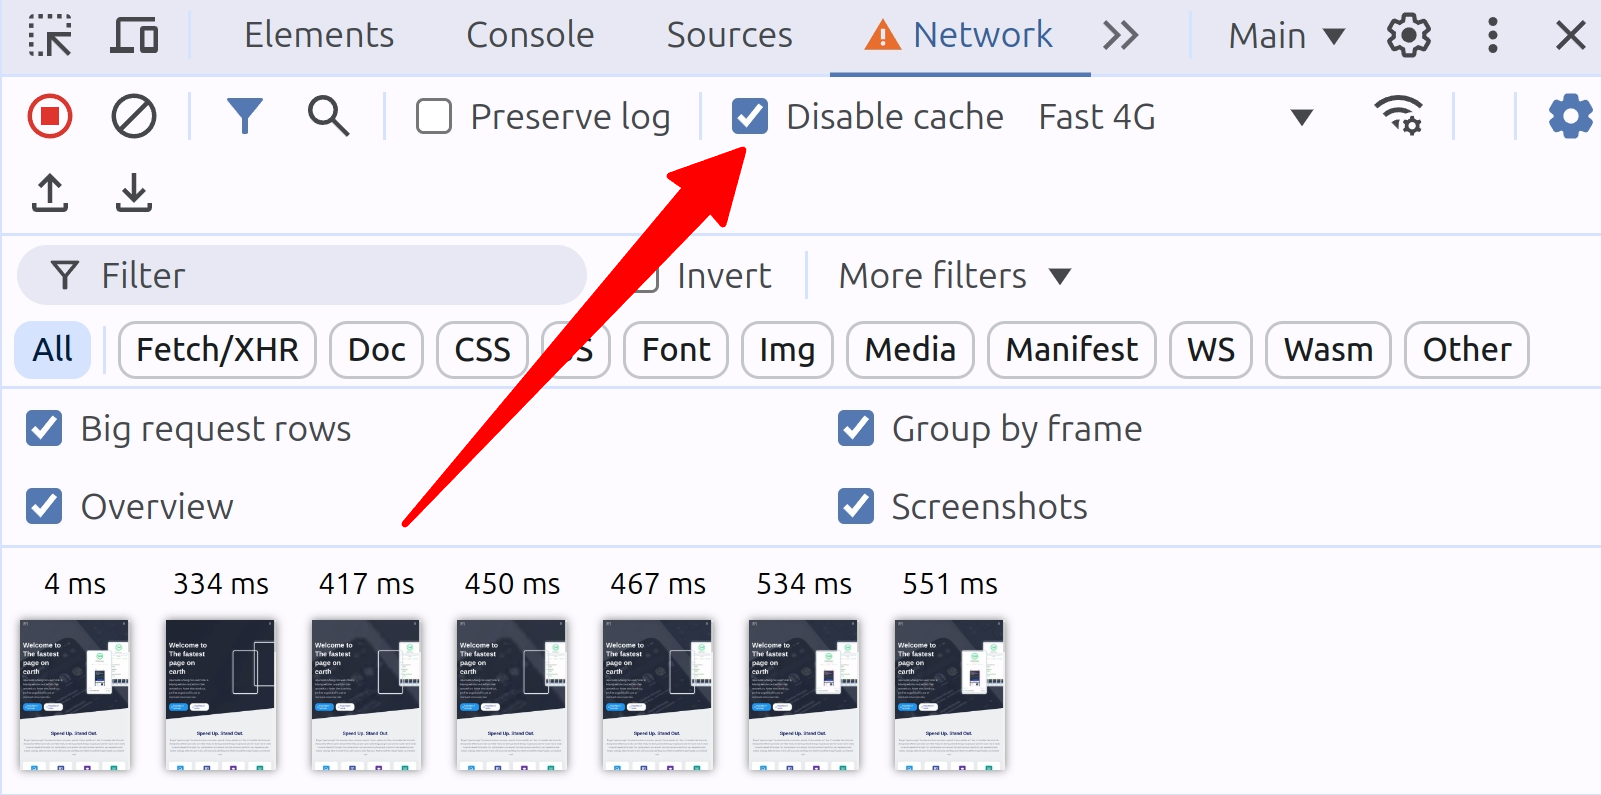
To ensure you are testing your site as a first-time visitor would experience it, check the "Disable cache" checkbox in the Network panel.
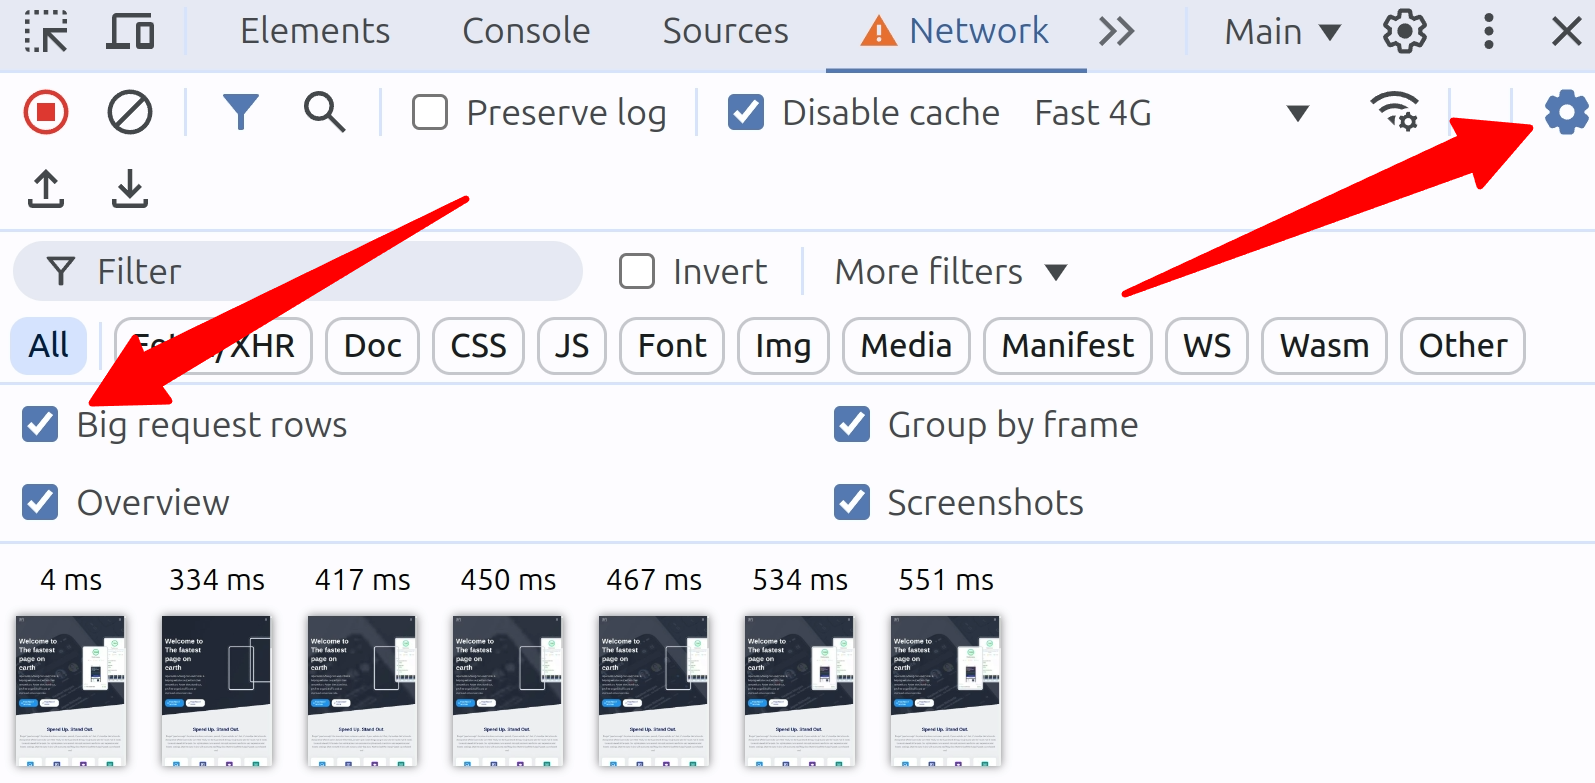
Enable Big Request Rows
Big request rows show critical details that the default compact view hides:
- The size column shows both the compressed (transfer) size and uncompressed (actual) size of each request.
- The name column shows the full path, not just the filename.
- The priority column shows the initial and final fetch priority. This is how you verify that your LCP image loads at High priority or spot when Chrome re-prioritizes a resource.
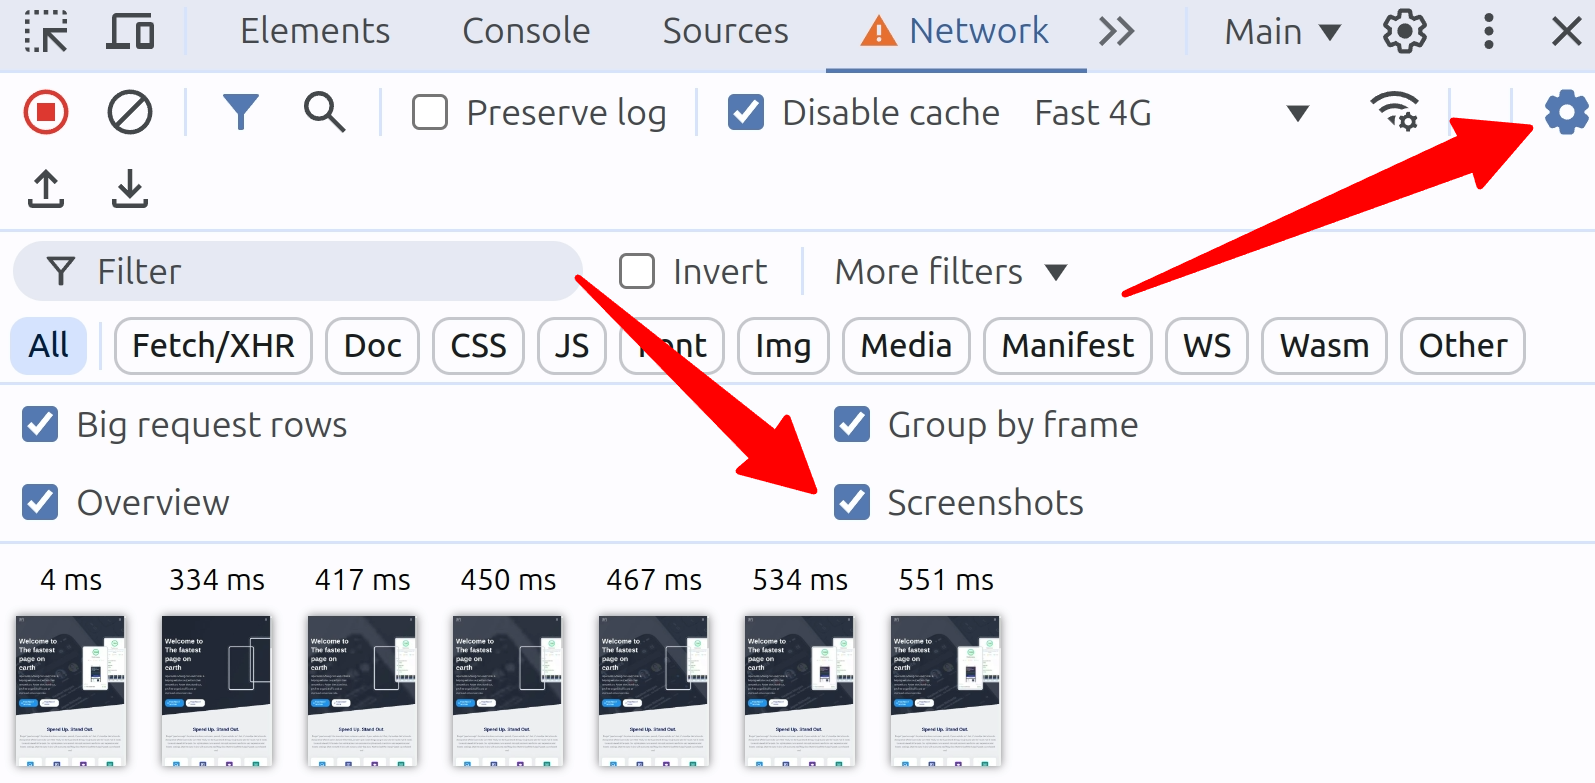
Enable Screenshots
Enable screenshots and Chrome captures a filmstrip of every visual change during page load. This is how you spot layout shifts and verify that your LCP element paints when you expect it to.
- With the Network tab in focus, press Ctrl+F5 (Cmd+R on Mac) to refresh the page.
- Chrome will capture screenshots during the page load process.
- Thumbnails of these screenshots will appear below the row of checkboxes in the Network panel.
The screenshot overview has some handy little features that you might not yet know about:
- Hover over a screenshot to see when it was captured. This will be indicated by a yellow vertical line on the Overview chart.
- Click on a screenshot thumbnail to filter out requests that occurred after that screenshot was taken.
- Double-click a thumbnail to zoom in and view the screenshot in more detail.
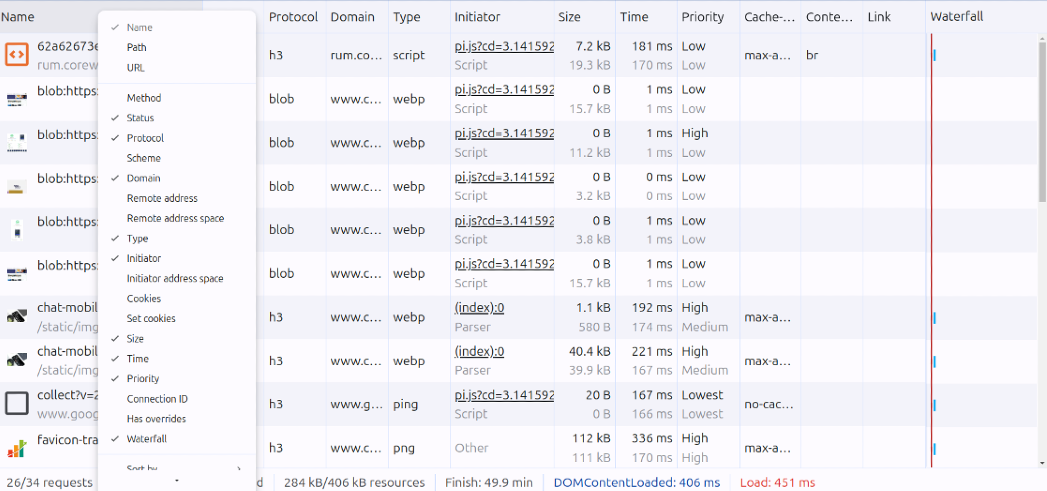
Enable the best Network columns
The default columns miss critical data. Right-click any column header to add more. These are the ones I enable on every audit:
| Column Name | Description | Why it matters for Core Web Vitals |
|---|---|---|
| Name | Request name | Identify every resource the browser downloads |
| Status | HTTP status codes | Spot redirects (301, 302) that add latency to your TTFB, and 404s for resources that waste a network round trip |
| Protocol | Network protocol used | HTTP/3 eliminates head-of-line blocking. According to Cloudflare Radar, only 21% of requests use HTTP/3. If your CDN supports it and you do not see h3 in this column, check your DNS configuration |
| Domain | Resource domain | Separate first-party from third-party requests. The 2024 Web Almanac found 92% of pages load at least one third party. Sorting by domain reveals how much of your waterfall is outside your control |
| Type | Resource type | Filter by type to isolate scripts, images, or fonts competing for bandwidth |
| Initiator | Request trigger | Find out which script or stylesheet triggered each request. This is how you trace a slow chain of critical requests back to its source |
| Size | Transfer and actual size | Spot uncompressed or oversized resources. The median mobile page loads 66 requests totaling 2.3 MB (2024 Web Almanac) |
| Priority | Resource loading priority | Shows initial and final fetch priority. Verify your LCP image loads at High and non-critical scripts load at Low |
| Waterfall | Visual timeline of requests | The timeline that shows where time is spent. Long bars before the first paint directly affect your LCP and FCP |
Enable custom response headers
| Column Name | Description | Why it matters for Core Web Vitals |
|---|---|---|
| Cache-Control | Resource caching behavior | Verify that static assets have long cache lifetimes and HTML has appropriate revalidation. Poor caching forces repeat visitors to re-download resources, hurting every metric. See also: Cloudflare caching configuration |
| Link | Link response header | Check whether your server sends preload or preconnect hints, including via 103 Early Hints |
| Content-Encoding | The encoding used | Verify your server sends Brotli (br) instead of gzip. Brotli compresses JavaScript 15 to 20% smaller than gzip. The 2024 Web Almanac shows Brotli has overtaken gzip for JavaScript resources (45% vs 41%) |
If you want to analyze response headers in bulk without opening DevTools for every page, try the HTTP Header Performance Analyzer.
Connect to the Performance panel
The Network panel shows you what loads and when. To see how each resource affects the Core Web Vitals, switch to the Performance panel. It now shows live LCP, CLS, and INP scores without recording and can overlay CrUX field data from real users. Use the Network panel to diagnose, the Performance panel to confirm.
For ongoing monitoring beyond a single debugging session, connect a Real User Monitoring tool so you can track whether your Network panel fixes actually improve field data over time.
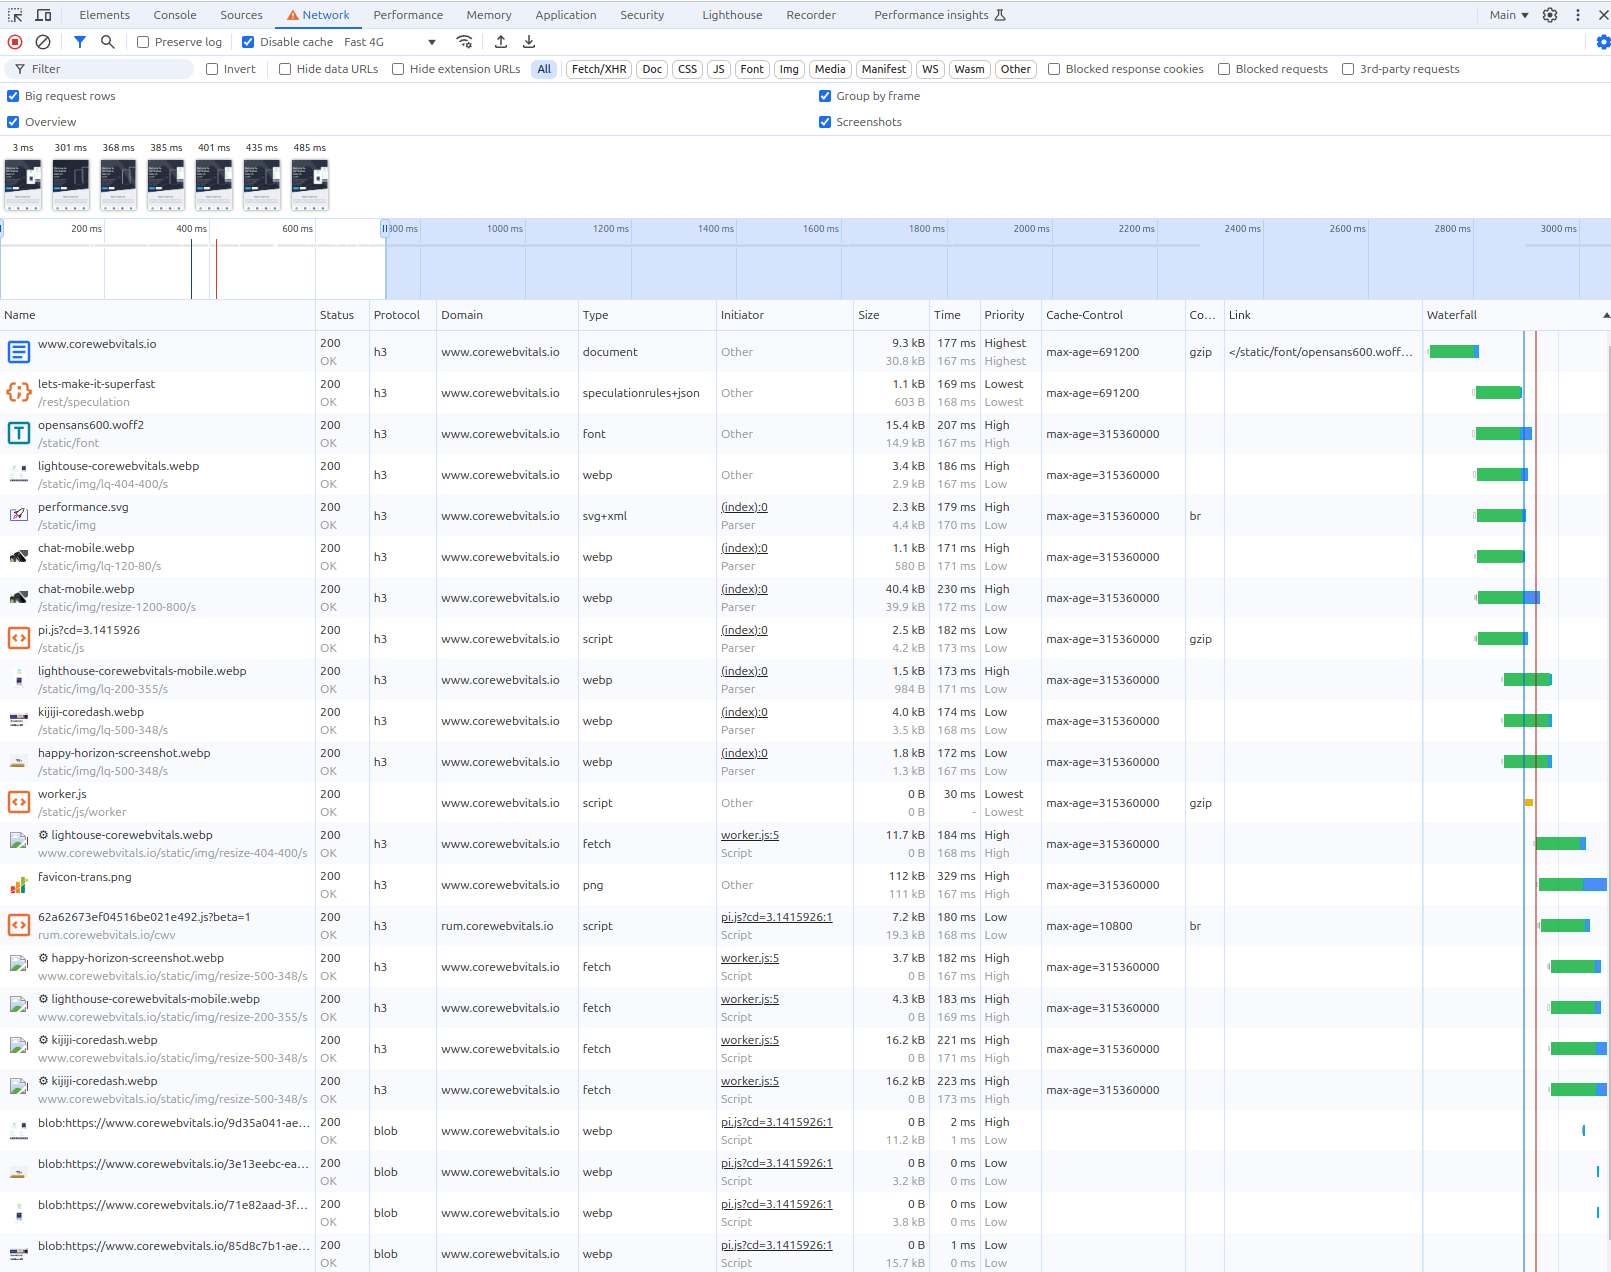
The complete setup
Reload the page with these settings and your Network panel looks like this. Every column maps to something that affects the Core Web Vitals.
I make sites pass Core Web Vitals.
500K+ pages for major European publishers and e-commerce platforms. I write the fixes and verify them with field data.
How I work
