Fix & Identify Time to First Byte (TTFB) Issues
Learn how to debug Time to First Byte issues on your pages using RUM data, Server-Timing headers, and systematic TTFB sub-part analysis

Find and Fix Time to First Byte (TTFB) Issues
This article is part of our Time to First Byte (TTFB) guide. TTFB is a diagnostic metric that measures the time between a user requesting a page and the browser receiving the first byte of the response. While TTFB is not a Core Web Vital itself, it directly influences both First Contentful Paint (FCP) and Largest Contentful Paint (LCP). A good TTFB is under 800 milliseconds at the 75th percentile.
In our previous article we talked about the Time to First Byte. If you would like to read up on the basics, that is a great place to start.
In this article we will focus on identifying the different Time to First Byte issues and then explain how to fix them.
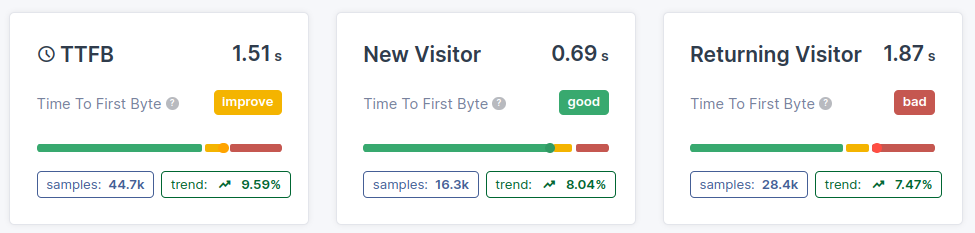
TTFB TIP: most of the time the TTFB will be much worse for first time visitors since they do not have a DNS cache for your site. When tracking the TTFB it makes a lot of sense to distinguish between first time and repeat visitors.
Table of Contents!
- Find and Fix Time to First Byte (TTFB) Issues
- Step 1: Check the TTFB in Search Console
- Step 1b: Use the Server-Timing Header for Deeper Insight
- Step 2: Set up RUM Tracking
- Step 2b: Establish a Performance Baseline
- Step 3: Identify Time to First Byte Issues
- Step 4: Zoom in to Problems and Fix
- Step 5: Quick Fix Checklist for Common TTFB Problems
- Measuring TTFB with JavaScript
- Further Reading: Optimization Guides
- TTFB Sub-parts: Complete Guides
Step 1: Check the TTFB in Search Console
"The first step to recovery is admitting that you have a problem." So before we do anything to fix the Time to First Byte, let us make sure that we really have a problem with the TTFB.
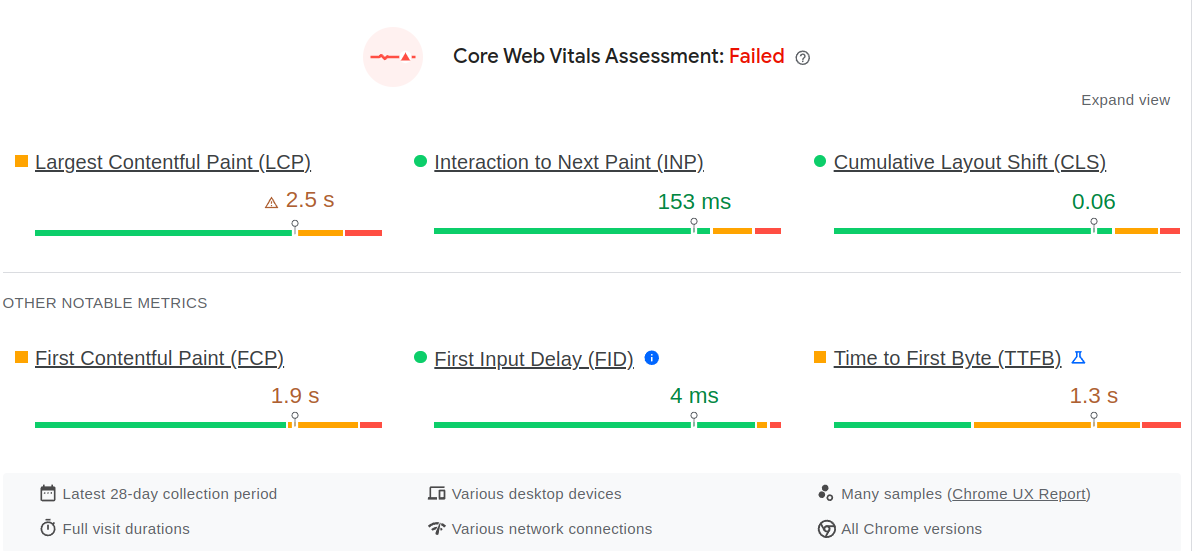
Unfortunately the Time to First Byte is not reported in Google Search Console, so we need to fall back to pagespeed.web.dev to query the CrUX data of our site. Fortunately the steps are easy: navigate to pagespeed.web.dev, enter the URL of your page, and make sure the "origin" button is checked (since we need site-wide data and not just homepage data). Now switch between Mobile and Desktop and check the Time to First Byte for both device types.
In the example below you will see a site that is failing the Core Web Vitals because of a high TTFB.
Step 1b: Use the Server-Timing Header for Deeper Insight
The Server-Timing HTTP response header allows your server to communicate backend performance metrics directly to the browser. This makes it possible to pinpoint exactly which part of the server processing is slow without needing access to server logs.
A typical Server-Timing header looks like this:
Server-Timing: db;dur=53, app;dur=120, cache;desc="miss"
In this example the server reports three timing values:
- db;dur=53: the database query took 53 milliseconds.
- app;dur=120: the application logic (template rendering, API calls, etc.) took 120 milliseconds.
- cache;desc="miss": the server cache was not used for this request (a cache miss).
You can read these values in Chrome DevTools by opening the Network tab, selecting the document request, and scrolling to the "Server Timing" section in the Timing tab. The values are also accessible through the PerformanceServerTiming API in JavaScript:
const [navigation] = performance.getEntriesByType('navigation');
if (navigation.serverTiming) {
  navigation.serverTiming.forEach(entry => {
    console.log(`${entry.name}: ${entry.duration}ms (${entry.description})`);
  });
}
If your server does not yet send Server-Timing headers, consider adding them. Most web frameworks make this simple. In PHP you can add the header before any output:
header('Server-Timing: db;dur=' . $dbTime . ', app;dur=' . $appTime);
In Node.js with Express:
res.setHeader('Server-Timing', `db;dur=${dbTime}, app;dur=${appTime}`);
The Server-Timing header is especially useful when combined with Real User Monitoring because it allows you to correlate server side performance with the TTFB that real users experience. Learn more about how 103 Early Hints can further reduce perceived TTFB by sending resource hints before the full response is ready.
Step 2: Set up RUM Tracking
The Time to First Byte is a tricky metric. We cannot simply rely on synthetic tests to measure the TTFB because in real life other factors will contribute to fluctuations in the TTFB. To get answers to all questions above we need to measure the data in real life and log any of the problems that might happen with the Time to First Byte. This is called Real User Monitoring, and there are several ways to enable RUM tracking. We have developed CoreDash just for these use cases. CoreDash is a low cost, fast, and effective RUM tool that gets the job done. Of course there are many RUM solutions out there and they will also do the job (at a higher price though).
How to think about the TTFB: Imagine a web server is a restaurant kitchen, and a user requesting a webpage is a hungry customer placing an order. Time to First Byte (TTFB) is the span of time between the customer placing their order and the kitchen starting to prepare the food.
So the TTFB is NOT about how fast the entire meal is cooked (First Contentful Paint) and served (Largest Contentful Paint), but rather how responsive the kitchen is to the initial request.
RUM Tracking compares to surveying the customers to understand their dining experience. You might find that customers seated further away from the kitchen receive less attention from the waiter and get served later, or that repeat customers get preferred treatment while new visitors have to wait longer for a table.
Step 2b: Establish a Performance Baseline
Before making any changes, establish a baseline for your TTFB. Record the 75th percentile TTFB across the following dimensions, as this will help you measure the effectiveness of your optimizations later:
- Overall TTFB (mobile and desktop separately): capture the 75th percentile for each device type.
- Top 10 pages by traffic: record the TTFB for your highest traffic pages individually.
- New visitors vs. repeat visitors: first time visitors typically have higher TTFB because of DNS and connection overhead.
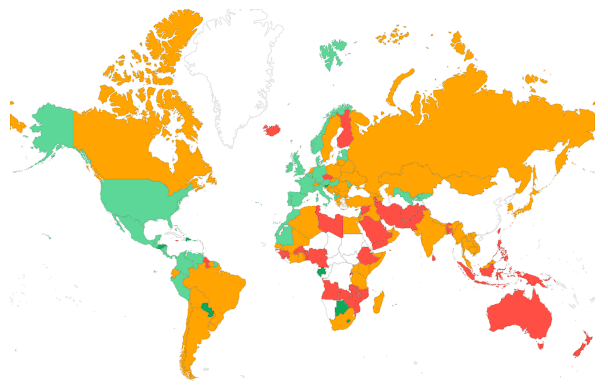
- Top 5 countries by traffic: geographic distance to your server significantly affects TTFB.
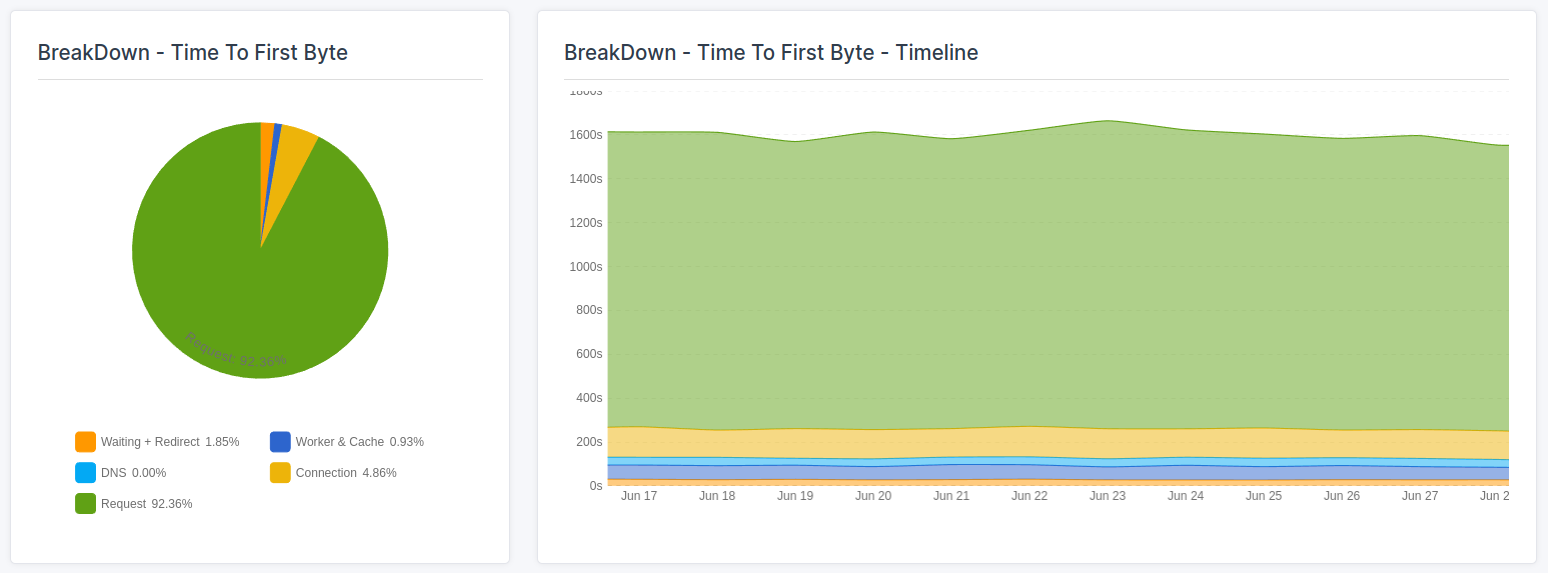
- TTFB sub-part breakdown: record the 75th percentile for each sub-part (waiting, cache, DNS, connection, request).
Document these numbers in a spreadsheet. After implementing each optimization, wait at least 7 days to collect enough RUM data before comparing results. A good approach is to tackle one TTFB sub-part at a time, measure, and then move on to the next.
Step 3: Identify Time to First Byte Issues
While Google's Chrome User Experience Report (CrUX) provides valuable field data, it does not offer specific details about the causes of high TTFB. To effectively improve TTFB we need to know exactly what is going on at a more detailed level. At this point it makes sense to distinguish between overall failing TTFB and TTFB failing under specific conditions (although in reality there will always be a mix).
3.1 TTFB Is Failing Overall
- Check for general poor "request times": Poor request times means that the "problem" is with the time it takes the server to generate the page. This is the most common cause for poor TTFB scores.
- Check for other poor TTFB sub-parts: The TTFB is not just a single metric but can be broken down into multiple parts that each have their own optimization potential. If the waiting duration, cache duration, DNS lookup duration, or the connection duration are slow, you would likely need to tune your server settings or start looking for better quality hosting.
3.2 TTFB Is Failing Under Specific Conditions
- Country segmentation: Understanding the geographical distribution of high TTFB is important, especially for websites with a global audience. If you are serving your pages from one server in just one country (without CDN edge caching), the physical distance between the user's location and the server hosting the website will cause all sorts of delays and will impact the TTFB. Consider configuring Cloudflare or another CDN to bring your content closer to users worldwide.
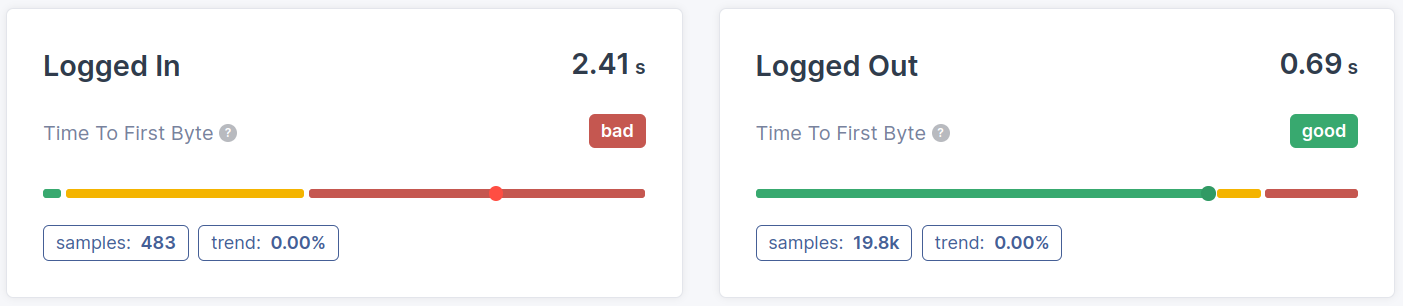
- Cache segmentation: Caching can reduce TTFB by skipping the server side generation of the HTML. Unfortunately it is common that caching is disabled or bypassed for many reasons. For example, caching can be disabled for logged in users, shopping cart pages, pages with query strings (e.g., from Google Ads), search result pages, and checkout pages. If your website uses (edge) caching, use RUM tracking to check the cache hit ratio.
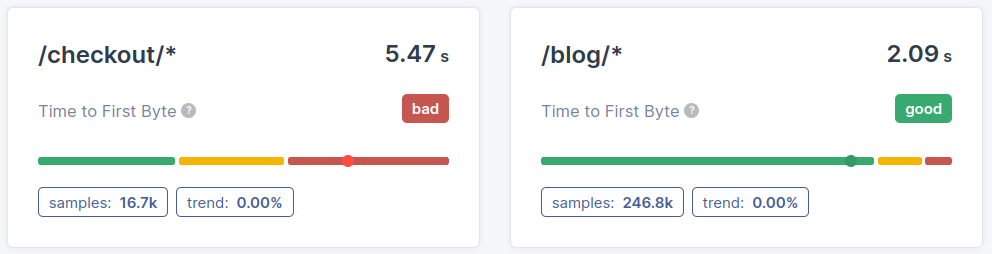
- Page (cluster) segmentation: The difference in Time to First Byte performance (or the lack of difference) between pages or page types is another thing we need to determine. Knowing which pages fail the TTFB metric will give valuable insights in how to improve the Time to First Byte.
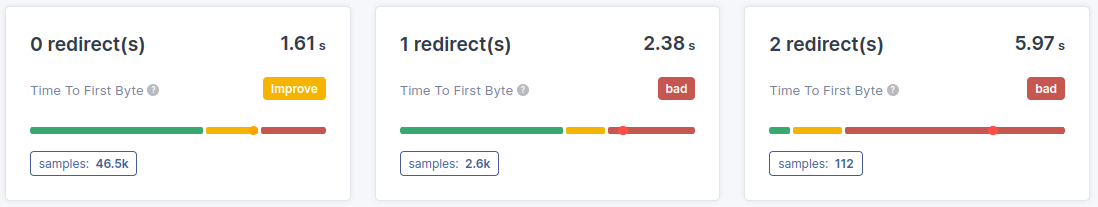
- Redirect segmentation: Redirect time gets added directly to the TTFB. Each redirect adds extra time before the web server can start loading the page. Measuring and eliminating unnecessary redirects can help to improve the TTFB. For a deeper look at redirect optimization, see our guide to the waiting duration sub-part of the TTFB.
- Other segmentation: While segmenting by the above variables covers the usual suspects, every site is unique and has its own challenges. Fortunately RUM tracking is designed to allow segmentation by many more variables like Device RAM, Network Speed, Device Type, Operating System, custom variables, and much more.
Step 4: Zoom in to Problems and Fix
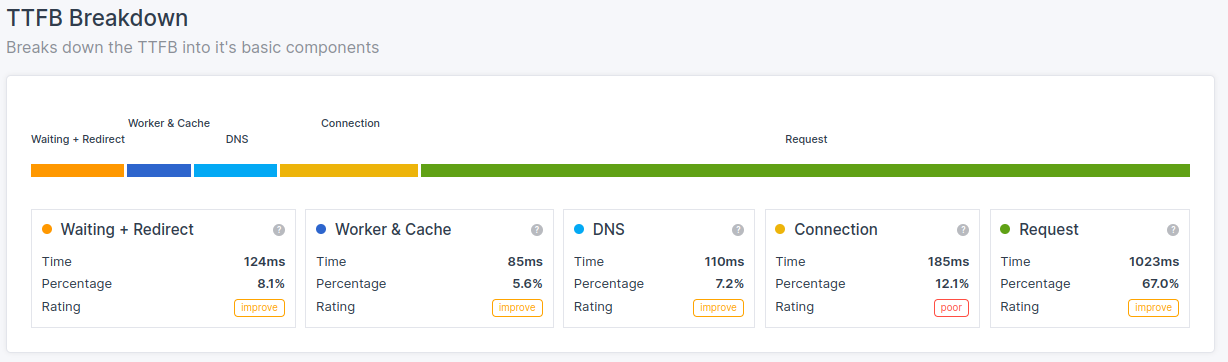
The sub-parts of the Time to First Byte (TTFB) are:
- Waiting + Redirect (or waiting duration)
- Worker + Cache (or cache duration)
- DNS (or DNS duration)
- Connection (or connection duration)
- Request (or request duration)
Step 5: Quick Fix Checklist for Common TTFB Problems
Based on the sub-part that is contributing most to your TTFB, here is a quick reference for the most common fixes:
| TTFB Sub-part | Most Common Cause | Quick Fix |
|---|---|---|
| Waiting duration | Unnecessary redirects | Audit and eliminate redirect chains; implement HSTS |
| Cache duration | Slow service worker boot | Simplify service worker code; use efficient caching strategies |
| DNS duration | Slow DNS provider | Switch to a premium DNS provider like Cloudflare; adjust TTL settings |
| Connection duration | Outdated TLS version | Enable TLS 1.3 and HTTP/3; use a CDN for proximity |
| Request duration | Slow server processing | Implement server side caching; optimize database queries; use 103 Early Hints |
Measuring TTFB with JavaScript
You can measure the full TTFB and its sub-parts directly in the browser using the Navigation Timing API. The following snippet calculates the TTFB and logs each sub-part:
new PerformanceObserver((entryList) => {
  const [nav] = entryList.getEntriesByType('navigation');
  const activationStart = nav.activationStart || 0;

  const ttfb = nav.responseStart - activationStart;
  const waitingDuration = (nav.workerStart || nav.fetchStart) - activationStart;
  const cacheDuration = nav.domainLookupStart - (nav.workerStart || nav.fetchStart);
  const dnsDuration = nav.domainLookupEnd - nav.domainLookupStart;
  const connectionDuration = nav.connectEnd - nav.connectStart;
  const requestDuration = nav.responseStart - nav.requestStart;

  console.log('TTFB:', ttfb.toFixed(0), 'ms');
  console.log('  Waiting:', waitingDuration.toFixed(0), 'ms');
  console.log('  Cache:', cacheDuration.toFixed(0), 'ms');
  console.log('  DNS:', dnsDuration.toFixed(0), 'ms');
  console.log('  Connection:', connectionDuration.toFixed(0), 'ms');
  console.log('  Request:', requestDuration.toFixed(0), 'ms');
}).observe({
  type: 'navigation',
  buffered: true
});
This code provides the same breakdown that tools like CoreDash display in the TTFB attribution panel. Running this snippet in the browser console gives you an immediate reading for a single page load, while RUM tools collect this data across thousands of real users to produce reliable 75th percentile values.
Further Reading: Optimization Guides
Related guides:
- 103 Early Hints: send resource hints before the full response is ready, allowing the browser to start loading critical resources while the server is still processing.
- Configure Cloudflare for Performance: set up Cloudflare's CDN, caching, and edge features to reduce TTFB for global audiences.
TTFB Sub-parts: Complete Guides
Each sub-part of the Time to First Byte has its own optimization strategies. Start with whichever sub-part your RUM data identifies as the bottleneck:
- Waiting Duration: redirects, browser queuing, and HSTS optimization.
- Cache Duration: service worker performance, browser cache, and bfcache.
- DNS Duration: DNS provider selection, TTL configuration, and dns-prefetch.
- Connection Duration: TCP handshake, TLS optimization, HTTP/3, and preconnect.
- Request Duration: server processing time, database queries, and backend optimization.
Performance degrades the moment you stop watching.
I set up the monitoring, the budgets, and the processes. That is the difference between a fix and a solution.
Let's talk
