Fix & Identify Largest Contentful Paint (LCP) Issues
Learn how to debug and fix all Largest Contentful Paint related issues on your page

This guide is part of the Largest Contentful Paint (LCP) hub. LCP measures how fast the largest visible element renders. Google wants it under 2.5 seconds. What follows is the exact diagnostic process I use when consulting on page speed.
A Consultant's Guide to Diagnosing and Fixing LCP
My name is Arjen Karel, and I'm a page speed consultant. Over the years, I've audited hundreds of websites, and one of the most persistent challenges is Largest Contentful Paint (LCP). In this guide, I'll share the exact methodology I use to diagnose and resolve LCP issues. You'll see mentions of CoreDash, a RUM tool I created to get the precise data needed for this process. The principles here are universal, but I believe in showing real examples from the tools I build and use daily.
Improving LCP is a process of elimination. According to the 2025 Web Almanac, only 66% of mobile origins pass LCP. That means a third of the web has a loading problem. Find the slowest phase, fix it, measure again.
The Diagnostic Methodology: Field Data First, Lab Data Second
To optimize effectively, you must adopt a two-step diagnostic workflow. This ensures you are solving problems your users are actually facing, not just chasing scores in a lab environment.
- Field Data (RUM & CrUX) shows you WHAT is happening. Field data is collected from real users visiting your site. It tells you if you have an LCP problem, which pages are affected, and which users (mobile or desktop) are experiencing it. You must always start here to confirm a real problem exists.
- Lab Data (Lighthouse, DevTools) helps you diagnose WHY it's happening. Lab data is collected in a controlled, simulated environment. Once your field data has confirmed a problem on a specific page, you can use lab tools to consistently replicate the issue and dissect the loading process to find the root cause.
Start with field data so your optimization efforts target changes that actually impact real users.
Table of Contents!
Key Terminology
- Field Data: Also known as Real User Monitoring (RUM), this is performance data collected from actual users in diverse, real-world conditions (varying devices, network speeds, and locations).
- Lab Data: Performance data collected within a controlled, consistent environment using tools like Lighthouse. It is ideal for debugging and testing changes, but does not always reflect real-user experience.
- CrUX: The Chrome User Experience Report. A public dataset from Google that contains field data from millions of Chrome users. It powers the Core Web Vitals report in Google Search Console.
- TTFB (Time to First Byte): The time between the browser requesting a page and when it receives the very first byte of the HTML response. It is a measure of server responsiveness.
Step 1: Identify LCP Issues with Field Data
Your first task is to use real-user data to confirm which pages, if any, have a poor LCP.
An Accessible Starting Point: Google Search Console
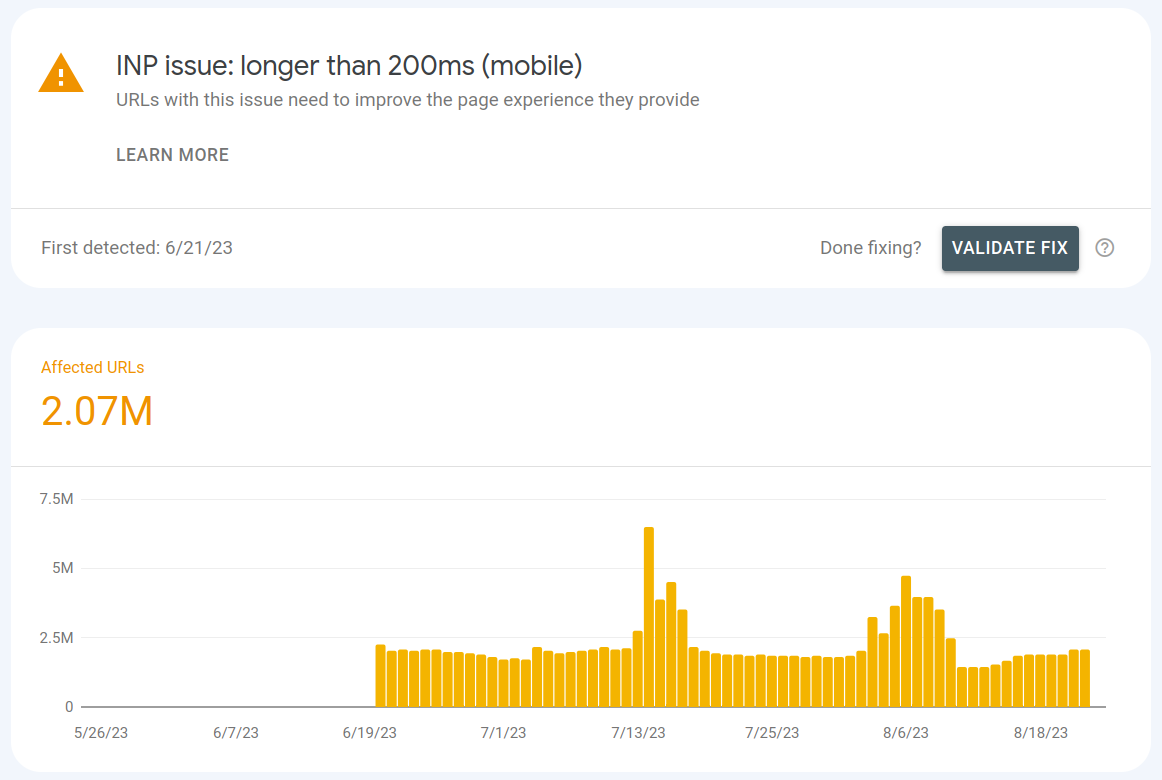
A valid place to start is the Core Web Vitals report in Google Search Console. Log in, navigate to the report, and review the mobile and desktop charts. If Google is flagging URLs with "LCP issue: longer than 2.5s," you have confirmation from the Chrome User Experience (CrUX) Report that a percentage of your users are having a poor experience.
Search Console confirms the problem, but it updates slowly and groups URLs together. For page-level detail in real time, you need a RUM tool.
Real User Monitoring (RUM): Page-Level Detail
You can build your own RUM setup using the web-vitals library to send data to your analytics backend, but that is a significant engineering effort.
I built CoreDash specifically for this. You add one script tag and it starts collecting LCP data from every real visitor, broken down by page, device, and element.
A good RUM tool lets you see:
- Your precise LCP score for any specific URL.
- A breakdown of every LCP element (e.g., an image, a headline) and which ones are most frequently associated with a slow LCP.
- The exact timing for each of the four LCP phases for every page view, pinpointing the bottleneck.
Looking beyond the LCP element itself matters. In a well-documented case study, Vodafone improved their LCP by 31%, which directly contributed to an 8% increase in sales. Their optimization focused on identifying and resolving the specific LCP bottleneck on key landing pages using a combination of field data analysis and targeted fixes. LCP optimization is not just about the image. You need to understand the full loading pipeline: server response, resource discovery, download, and paint.
For example, in CoreDash, you can navigate to the LCP page and view a data table that shows your slowest LCP elements. By clicking on a specific element (like a particular CSS class for a hero image), you can filter all the metrics to see the performance data just for pages where that element was the LCP.
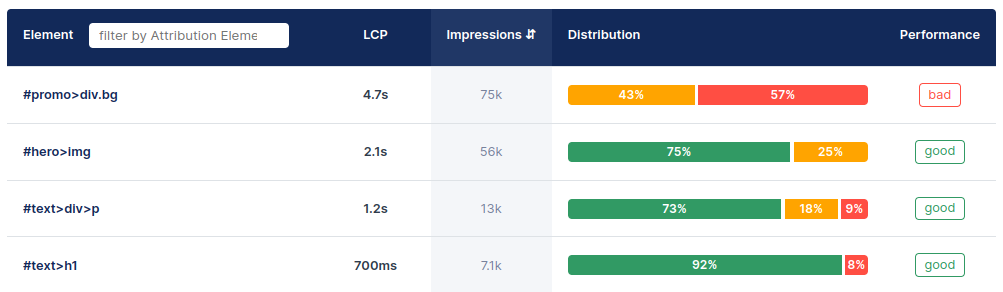
The goal: use field data to find your slowest page and its most common LCP element. That is your target.
Measuring LCP with the Performance Observer API
The Performance Observer API gives you direct access to LCP entries in JavaScript. This is the same API that RUM tools use under the hood to collect field data. The following snippet logs every LCP candidate the browser identifies, including the element, its size, and the render time.
const observer = new PerformanceObserver((list) => {
  const entries = list.getEntries();
  const lastEntry = entries[entries.length - 1];
  console.log('LCP element:', lastEntry.element);
  console.log('LCP time:', lastEntry.renderTime || lastEntry.loadTime);
  console.log('LCP size:', lastEntry.size);
});
observer.observe({ type: 'largest-contentful-paint', buffered: true });
This is useful for quick validation during development, but for production measurement you should use the web-vitals library, which handles edge cases like tab visibility changes and back/forward cache restores.
Step 2: Diagnose the Bottleneck with Lab Tools
You know which page to fix. Now figure out why it's slow. Run a test with PageSpeed Insights or the Lighthouse panel in Chrome DevTools.
In the report, scroll down to the "Diagnostics" section and find the "Largest Contentful Paint element" audit. This waterfall chart breaks down your LCP time into its four sub-parts. Your RUM tool should show a similar breakdown based on your field data.
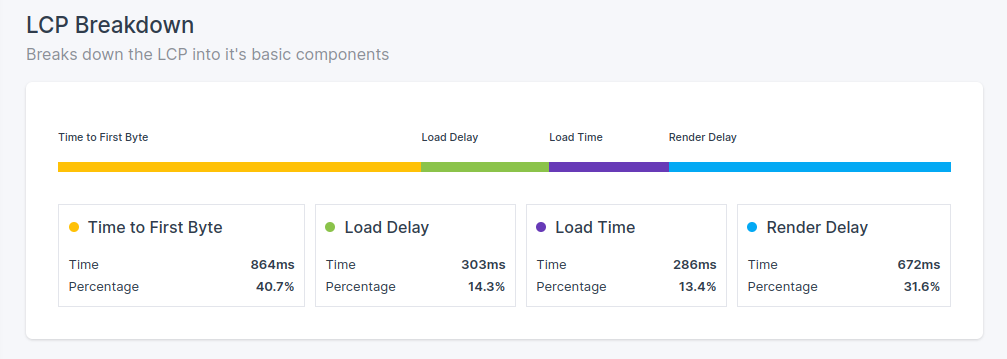
Your goal is to find the longest phase in this breakdown. That's your primary bottleneck, and that's where you should focus your optimization efforts first.
Step-by-step guide: prefer working in DevTools? Diagnose LCP with the Chrome DevTools Performance panel shows how to record a throttled trace and read the same four sub-parts from the LCP breakdown insight.
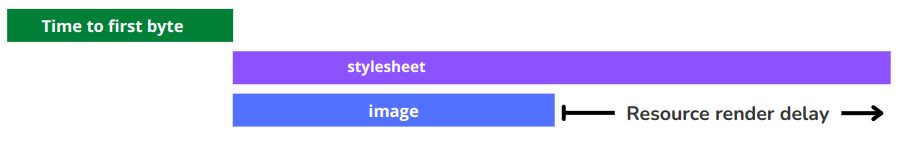
Step 3: Understanding the Four LCP Phases
Every LCP score is the sum of four sequential phases. Each phase has a dedicated guide on this site covering specific optimization techniques.
- Time to First Byte (TTFB): This is the unskippable foundation. A slow server response is a direct, millisecond-for-millisecond addition to your LCP. Before you optimize a single image, you must ensure your server is responding quickly. Learn more about optimizing TTFB.
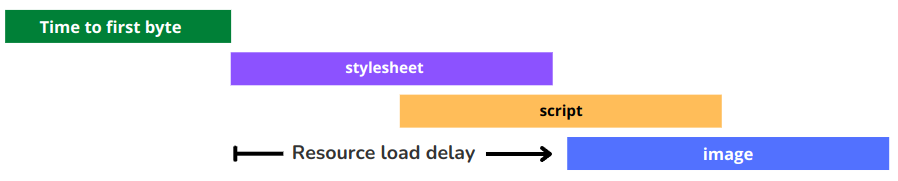
- Resource Load Delay: This is the "discovery problem" and one of the most common issues. The browser can't download a resource it doesn't know about. If your LCP image is hidden in a CSS or JavaScript file, or even if it's in the HTML but other resources are requested first, the browser finds it too late, wasting valuable time. Read the full guide on Resource Load Delay.
- Resource Load Duration: This is the download time for the LCP resource itself. Large, uncompressed images or slow network conditions can make this phase a bottleneck. Read the full guide on Resource Load Duration.
- Element Render Delay: This is the "too busy to paint" problem. The LCP image file might be fully downloaded, but if the browser's main thread is blocked by heavy JavaScript execution, it simply can't get around to painting the image on the screen. Read the full guide on Element Render Delay.
Always start by ensuring your TTFB is fast and your LCP resource is discoverable before moving on to file size and render optimizations.
Step 4: Execute the Fix
With the bottleneck identified, apply the fix. The implementation depends on your stack. Each phase below covers universal principles first, then WordPress and JS framework specifics.
1. Optimizing Time to First Byte (TTFB)
If your TTFB is slow (a good target is under 800ms), it sets a high floor for your LCP. Improving TTFB will improve every other loading metric.

Universal TTFB Solutions
- Enable Caching: This is one of the most effective ways to improve TTFB. Caching generates and stores a copy of the page so it can be served instantly without waiting for the server to build it from scratch on every visit.
- Use a CDN: A Content Delivery Network serves your content from a server physically close to your user, which reduces network latency. Caching your full HTML pages at the CDN's edge is a powerful strategy for a fast, global TTFB. For detailed CDN configuration tips, see our guide on how to configure Cloudflare for optimal performance.
- Use Brotli or Gzip Compression: Ensure your server is compressing text-based assets like HTML, CSS, and JavaScript. Brotli offers better compression than Gzip and should be preferred.
- Use HTTP/3 with 0-RTT: Ensure your server is configured to use HTTP/3. It offers significant performance advantages, including better multiplexing. It supports 0-RTT (Zero Round Trip Time Resumption), which eliminates the connection setup time for repeat visitors, providing an instant TTFB boost.
- Use 103 Early Hints: For an advanced boost, use the 103 Early Hints status code. This allows your server or CDN to send hints about critical CSS and JS files to the browser while it's still preparing the full HTML document, allowing downloads to start even sooner. For a complete implementation guide, see our article on 103 Early Hints.
Platform-Specific TTFB Fixes
On WordPress:
- Invest in Quality Hosting: On WordPress, slow TTFB is often related to the hosting environment. Cheap, shared hosting can be a bottleneck. Consider a managed WordPress host that is optimized for performance.
- Use a Caching Plugin: A high-quality caching plugin (e.g., WP Rocket, W3 Total Cache) is non-negotiable. It handles the generation of static HTML files for you, which is the core of effective caching on this platform.
On a JS Framework:
- Choose the Right Hosting Platform: For Node.js applications, platforms like Vercel or Netlify are highly optimized for SSR/SSG frameworks and offer intelligent caching and serverless function execution out of the box.
- Implement SSR Caching: If you're using Server-Side Rendering, cache the rendered pages on the server (e.g., using Redis or an in-memory cache) to avoid re-rendering on every request.
- Beware of Serverless Cold Starts: If using serverless functions for rendering, be aware that a "cold start" (the first request after a period of inactivity) can have a high TTFB. Use provisioned concurrency or keep-alive strategies to mitigate this.
2. Reducing Resource Load Delay
This is frequently the largest bottleneck. It means the browser was ready to work, but it couldn't find your main image or font file right away. This delay is typically caused by one of two problems: the resource is discovered late, or it's given a low download priority. For the complete guide on this topic, read our dedicated guide on Resource Load Delay.
Universal Load Delay Solutions
The universal solution to Resource Load Delay is to ensure your LCP resource is both discoverable in the initial HTML markup and given a high priority by the browser. Here's how to achieve that:
- Make the LCP Resource Discoverable: The most important step is to ensure your
LCP element is present in the HTML that the server sends. Browsers use a high-speed "preload
scanner" to look ahead in the raw HTML for resources like images and scripts to download. If
your LCP image is loaded via a CSS
background-imageor injected with JavaScript, it's invisible to this scanner, causing a major delay. The most robust solution is always to use a standard<img>tag with asrcattribute in your server-rendered HTML. - Control the Load Order with
preload: If you cannot make the LCP resource directly discoverable (a common issue with fonts or CSS background images), the next best solution is to use<link rel="preload">. This tag acts as an explicit instruction in your HTML<head>, telling the browser to start downloading a critical resource much earlier than it would have found it naturally. For implementation details and examples, see our guide on how to preload the LCP image. - Ensure High Priority with
fetchpriority: Even when a resource is discoverable, the browser might not give it the highest download priority. Addingfetchpriority="high"to your<img>tag or your<link rel="preload">tag is a powerful hint to the browser that this specific resource is the most important one for the user experience, helping it win the race for bandwidth against other resources.
Platform-Specific Load Delay Fixes
On WordPress:
- Avoid Page Builder Background Images: Many page builders make it easy to set a
hero image as a CSS
background-imageon adiv. This makes it invisible to the browser's preload scanner. If possible, use a standard<img>block instead. If not, you may need a plugin or custom code to preload that specific image. - Disable Lazy-Loading for the LCP Image: Many optimization plugins will automatically lazy-load all images. You must find the setting in your plugin to exclude the LCP image (and often the first few images on the page) from being lazy-loaded. This is such a common mistake that we have a dedicated article on fixing lazily loaded LCP images.
On a JS Framework:
- Use Server-Side Rendering (SSR): This is often the most impactful fix. A
default Client-Side Rendered (CSR) React app sends minimal HTML, and the LCP element only exists
after a large JS bundle is downloaded and executed. SSR frameworks like Next.js or Remix deliver
the complete HTML, including the
<img>tag, so the browser can discover it immediately. - Use Framework-Specific Image Components: Frameworks like Next.js offer an
image component with a
priorityprop. Using the priority prop automatically appliesfetchpriority="high"and other optimizations to your LCP image.
3. Decreasing Resource Load Duration
Ensuring your LCP resource is as small as possible is still an essential part of the process. This phase is about how long it takes to download the LCP resource file over the network. For a complete guide on image optimization techniques, see our article on optimizing the LCP image, and for more on Resource Load Duration specifically.

Universal Load Time Solutions
- Reduce File Size with Modern Formats and Responsive Images: The most direct way
to shorten download time is to make the file smaller. For images, this means using modern,
highly-efficient formats like AVIF or WebP. You must also serve responsive
images using the
<picture>element or thesrcsetandsizesattributes. This ensures that a user on a mobile device receives an image appropriately sized for their smaller screen, rather than being forced to download a massive desktop-sized image. A 400-pixel wide mobile screen simply doesn't need a 2000-pixel wide image file. For text-based LCPs, ensure your fonts are in the efficient WOFF2 format and are subsetted to remove unused characters. - Reduce Network Contention: The LCP resource has to compete for the user's limited network bandwidth. Deferring non-critical resources, like analytics scripts or CSS for below-the-fold content, frees up bandwidth so the browser can focus on downloading the LCP resource faster.
- Host Critical Resources on Your Main Domain: Avoid loading your LCP resource from a different domain if possible. Setting up a new connection to another server adds time-consuming DNS lookups and handshakes.
Platform-Specific Load Time Fixes
On WordPress:
- Use an Image Optimization Plugin: Tools like ShortPixel or Smush can
automatically compress images on upload, convert them to modern formats like WebP/AVIF, and
generate responsive
srcsetsizes. - Manually Resize Images: Before uploading, resize your images to be no larger than they need to be. Don't upload a 4000px wide image for a space that is only 1200px wide on the largest screens.
On a JS Framework:
- Use an Image CDN: This is a powerful solution. Services like Cloudinary, Imgix, or Akamai's Image & Video Manager can automate the entire optimization process. You upload one high-quality image, and they deliver a perfectly sized, compressed, and formatted version to each user via a fast CDN.
- Leverage Build Tools: When you import an image into a component in a modern framework, the build tool (like Webpack or Vite) can automatically hash and optimize the file as part of the build process.
4. Shortening Element Render Delay
The resource has finished downloading, but it's not on the screen yet. This means the browser's main thread is busy with other tasks and can't paint the element. This is another very common and significant bottleneck. For the complete guide, read our guide on Element Render Delay.
Universal Render Delay Solutions
- Defer or Remove Unused JavaScript: Any JS that isn't essential for rendering
the initial, visible part of the page should be deferred using the
deferorasyncattributes. - Use Critical CSS: A large, render-blocking stylesheet can delay rendering. The
critical CSS technique involves extracting the minimum CSS needed to style the above-the-fold
content, inlining it in the
<head>, and loading the rest of the styles asynchronously. - Break Up Long Tasks: A long-running script can block the main thread for an extended period, preventing rendering. This is also a primary cause of poor Interaction to Next Paint (INP). Break up your code into smaller, asynchronous chunks that yield back to the main thread.
Platform-Specific Render Delay Fixes
On WordPress:
- Audit Your Plugins: Too many plugins, especially heavy ones like sliders or complex page builders, can add significant CSS and JS that blocks the main thread. Deactivate plugins one by one to identify performance hogs.
- Use a Lightweight Theme: A bloated theme with dozens of features you don't use can be a major source of render-blocking code. Choose a performance-focused theme.
- Use Plugin Asset Managers: Tools like Asset CleanUp or Perfmatters allow you to conditionally disable CSS and JS from specific plugins on pages where they are not needed.
On a JS Framework:
- Code Splitting is Key: Don't ship all your app's JavaScript in one giant bundle. Split your code by route (so users only download the code for the page they are visiting) and by component.
- Lazy Load Components: Use
React.lazyandSuspenseto lazy-load components that are not immediately visible (e.g., components below the fold or in modals). This keeps them out of the initial bundle.
Advanced: Optimizing LCP for Subsequent Navigations
Fixing the initial LCP is important, but you can make browsing your site feel instant by optimizing for subsequent page loads.
Ensure Pages are Eligible for the Back/Forward Cache (bfcache)
The bfcache is a browser optimization that stores a complete snapshot of a page in memory when a user
navigates away. If they click the back button, the page can be restored instantly, resulting in a
near-zero LCP. Many pages are ineligible for this cache due to things like unload event listeners.
Use the Lighthouse "bfcache" audit to test your pages and remove any blocking features.
Use the Speculation Rules API for Prerendering
The Speculation Rules API allows you to declaratively tell the browser
which pages a user is likely to navigate to next. The browser can then fetch and pre-render these
pages in the background. When the user clicks a link to a prerendered page, the navigation is
instantaneous, leading to a near-zero LCP. You can define
these rules in a <script type="speculationrules"> tag in your HTML.
<script type="speculationrules">
 {
  "prerender": [{
   "source": "document",
   "where": {
    "href_matches": "/products/*"
   },
   "eagerness": "moderate"
  }]
 }
 </script>
This example tells the browser to look for links on the current page that go to product pages and to start prerendering them when a user hovers over the link.
Work through the four phases in order. Fix the biggest bottleneck first, measure again, repeat.
Next Steps: Each LCP Phase in Detail
Each LCP phase has its own guide:
- Optimize the LCP Image: A complete guide to image format selection, responsive images, preloading, and common image optimization mistakes.
- Resource Load Delay: How to ensure the browser discovers your LCP resource as early as possible using preload, fetchpriority, and proper HTML structure.
- Resource Load Duration: How to reduce the download time for your LCP resource through file compression, modern formats, CDN configuration, and network optimization.
- Element Render Delay: How to clear the browser's main thread so it can paint the LCP element immediately after download, covering critical CSS, JavaScript deferral, and content-visibility.
Performance degrades the moment you stop watching.
I set up the monitoring, the budgets, and the processes. That is the difference between a fix and a solution.
Let's talk
