Find and Fix Interaction to Next Paint (INP) Issues: A Step-by-Step Guide
Learn how to identify and fix Interaction to Next Paint issues using RUM data, Chrome DevTools, and the LoAF API

Find and Fix Interaction to Next Paint (INP) issues
This page is part of our Interaction to Next Paint (INP) series. INP measures the responsiveness of your website by tracking the delay between a user interaction and the next visual update. A good INP score is under 200 milliseconds, while scores above 500 milliseconds are rated poor. If you are new to INP, start with the INP hub page for a complete overview.
According to the 2025 Web Almanac, 23% of mobile origins still fail INP. If your site is one of them, here is the process: confirm the problem in Search Console, diagnose root causes with Real User Monitoring (RUM) data, replicate locally, and apply targeted fixes to each INP phase.
INP TIP: most of the time the INP will be much worse
when a user interacts with the page during the startup stage of page
loading. That is why, when debugging the INP,
it makes sense to log all interactions as well as the page loading state!
Table of Contents!
Step 1: Check the INP in Search Console
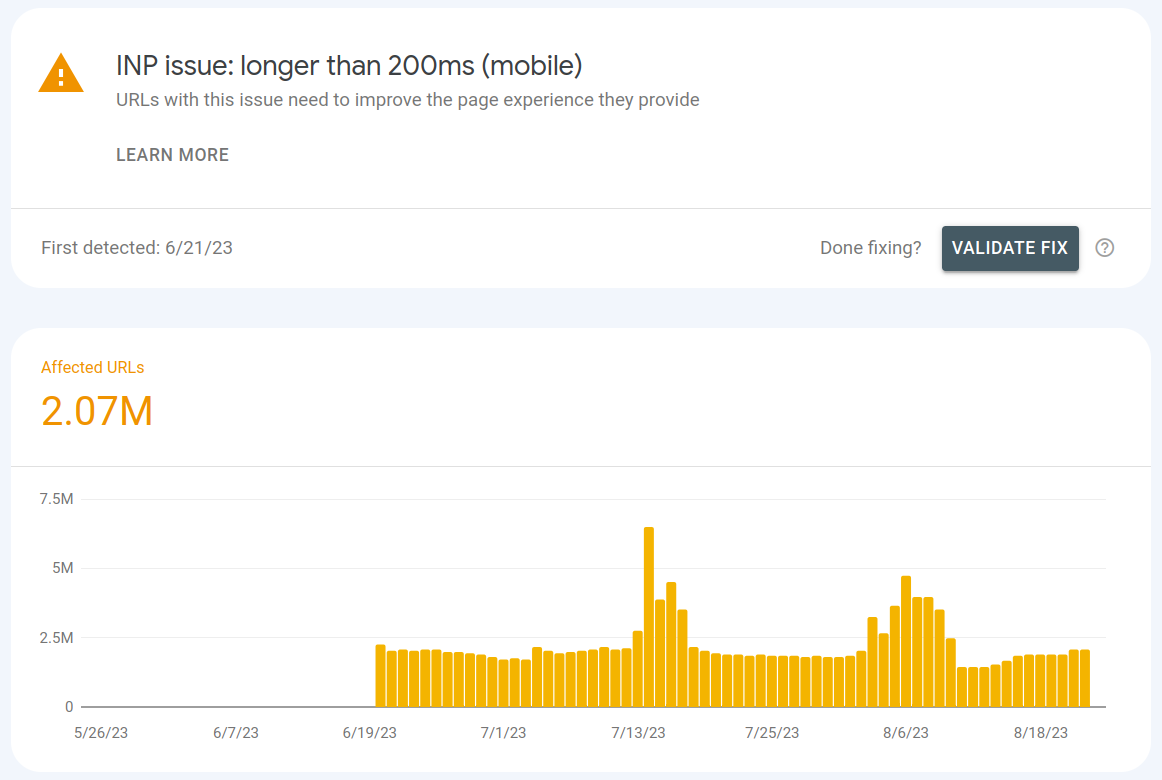
The first step is confirming that you actually have an INP problem. Before making any code changes, verify the issue in Google Search Console so you are working from real field data rather than assumptions.
Log in to your Google Search Console. In the left menu click Core Web Vitals and select either Mobile or Desktop (tip: most of the time INP issues surface on mobile first, so start with mobile).
Here you will see an overview of all Core Web Vitals related issues that are currently on your site. If one of these issues is INP related, you have confirmed there is a problem.
Step 2: Identify Interaction to Next Paint issues
Google Search Console does not give you any information apart from URL groups to figure out what is causing the problems with the Interaction to Next Paint. So most of the time developers just go in blindly. They start removing unused JavaScript (always a great idea) and breaking up the main thread (also a great idea), but that hardly ever fixes the INP completely.
That is why, when improving the INP, we need to know exactly what is going on. We need answers to four critical questions:
Which elements, when interacted with, cause a bad INP score?
Usually a bad INP score is not caused by one single element but a combination of issues. We need
to tackle them one by one, starting with the worst ones and working our way
up.
When do these interactions happen? Do they happen
during the start-up phase of
page load, or do they happen even when the main page has fully loaded?
Where do these
interactions happen? Do they happen on every page, or do they happen
only on a few selected pages?
How can we replicate
these interactions? You might have found out by now that it
is hard to replicate INP issues. That is why we need to set ourselves up for success by
mimicking device characteristics with a bad INP score.
Set up RUM tracking
To answer all these questions we need to start tracking real users and log any of the problems that
might happen with the Interaction to Next Paint. There are several ways to enable RUM tracking. The
first is by using the Web Vitals library and sending the results to your own analytics backend.
The upside to this method is that it is cheap and flexible. The downside is that it might be a lot
of extra work.
A good alternative to sending your Core Web Vitals data to your own backend is by using one of the many RUM tools out there. We have developed CoreDash just for these use cases. CoreDash is a low cost, fast and effective RUM tool that gets the job done. Of course there are many RUM solutions out there and they will also do the job (at a higher price though).
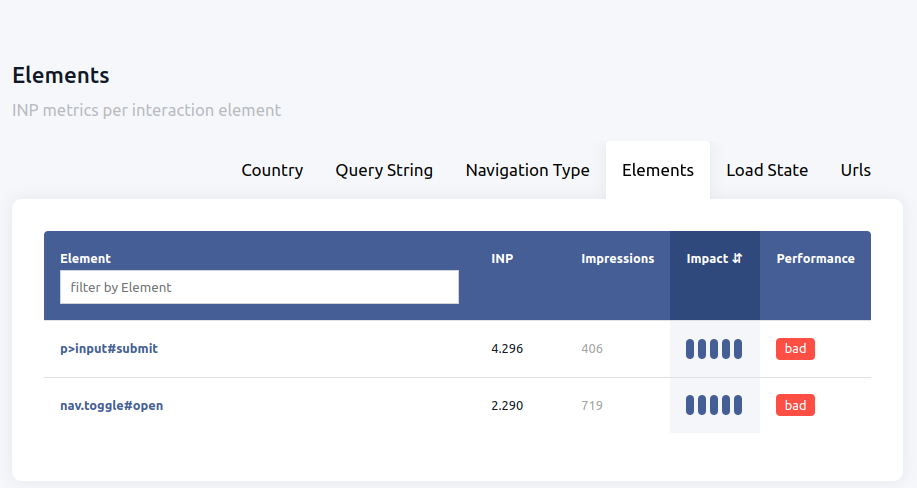
Find slow interactions per element that cause a high INP
Start by finding the slowest interactions that cause the worst INP scores. List your pages by "INP metric by Elements" in CoreDash and you will get your slowest interactions. Click on the first line to filter your metrics by these interactions.
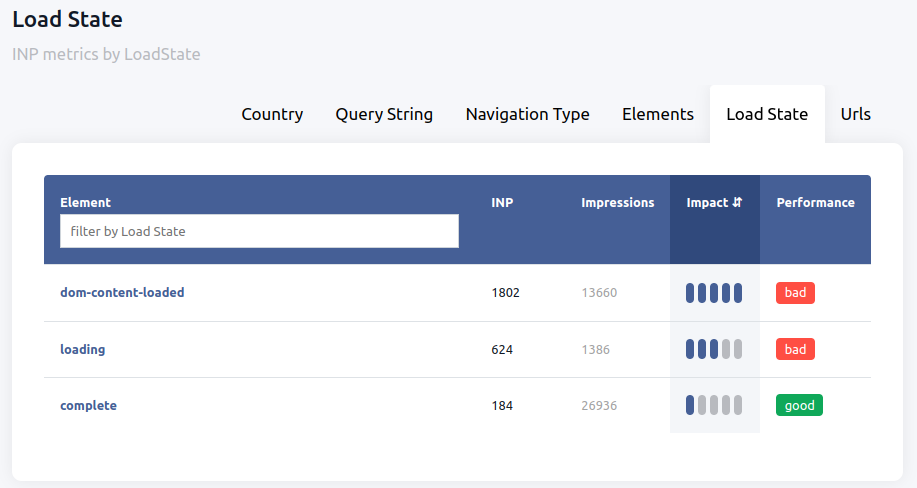
Find when bad INP interactions occur
Next, sort the filtered URLs by load state. This will give you more insight into the root cause of the INP. In this case the high INP happens when the DOM content has been loaded. This means scripts have been parsed but async scripts and the page's sub-resources have not yet been loaded. In this case the INP is caused by early clicks when the page load has not completely finished.
Continue by clicking the load state with the highest impact to create another filter.
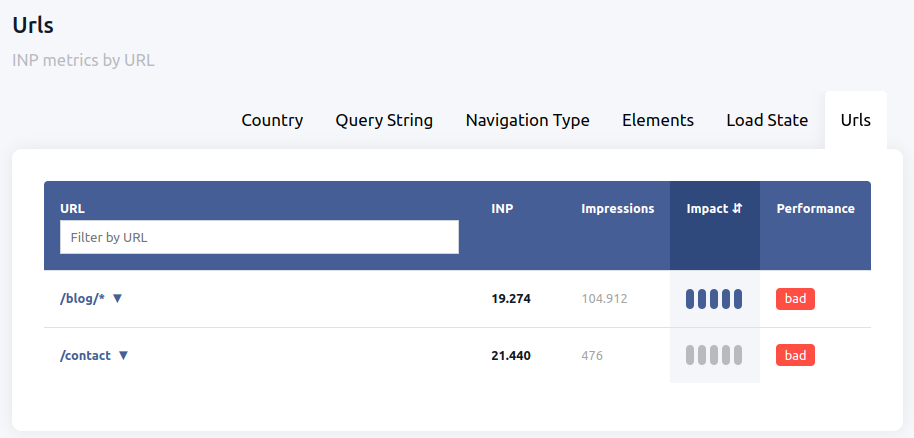
Find URLs responsible for high INP scores
Finally, when we have filtered for the elements with the slowest interaction and the correct load state, we are going to take a look at the URLs where the INP is at its worst. In this case this clearly happens on a specific set of pages.
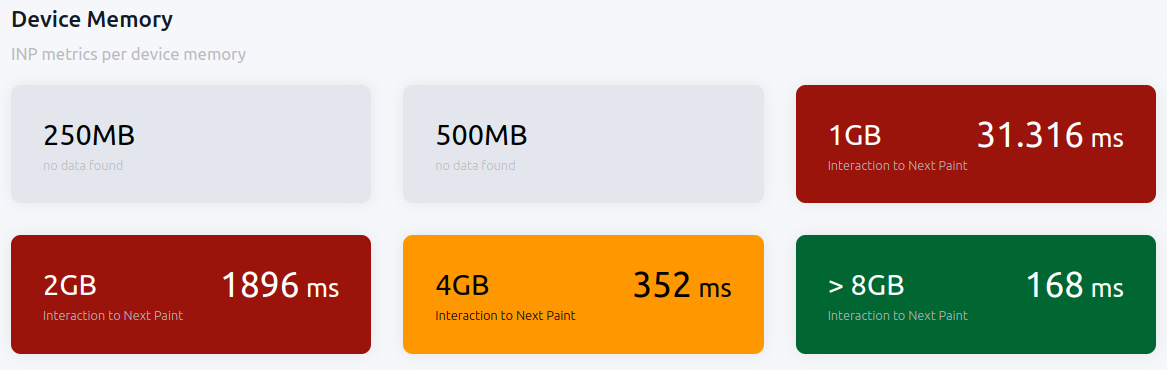
Find device characteristics
When we have identified slow interactions, load state, and URLs that cause a high Interaction to Next Paint, we are going to take a look at what types of visitors cause the worst INP scores. We would look at Device Memory, Bandwidth, Screen size, and other hardware characteristics. Once we have identified these characteristics we can move on to replicating and logging the issue.
Using the Long Animation Frames (LoAF) API for INP diagnostics
The Long Animation Frames API (LoAF) tells you exactly which scripts and functions cause slow interactions. Unlike the older Long Tasks API, LoAF gives you script URLs, function names, and timing breakdowns per frame. It is especially useful when combined with RUM data from a tool like CoreDash.
This observer collects LoAF entries for frames longer than 50ms, capturing script attribution, duration, and blocking time:
// Observe Long Animation Frames for INP attribution
const observer = new PerformanceObserver((list) => {
  for (const entry of list.getEntries()) {
    // Only log frames longer than 50ms
    if (entry.duration > 50) {
      console.log('Long Animation Frame:', {
        duration: entry.duration,
        blockingDuration: entry.blockingDuration,
        renderStart: entry.renderStart,
        styleAndLayoutStart: entry.styleAndLayoutStart,
        scripts: entry.scripts.map(script => ({
          sourceURL: script.sourceURL,
          sourceFunctionName: script.sourceFunctionName,
          invokerType: script.invokerType,
          invoker: script.invoker,
          duration: script.duration
        }))
      });
    }
  }
});

observer.observe({ type: 'long-animation-frame', buffered: true });
The LoAF API reveals which scripts contribute to each phase of the INP. The scripts array tells you the exact source file and function name, while renderStart and styleAndLayoutStart help you separate processing time from presentation delay. LoAF is currently Chromium-only (Chrome 123+), so for Firefox and Safari debugging, rely on the Performance panel trace and RUM data instead. For more on how async vs defer JavaScript loading affects these timings, see our dedicated guide.
Step 3: Replicate and debug interactions that cause a high INP score
With this data in hand, we can start fixing the root causes.
Set yourself up for success: replicate the INP failing circumstances
The next thing we should do is try and recreate the failing INP. We do this by mimicking the circumstances where the INP might be failing.
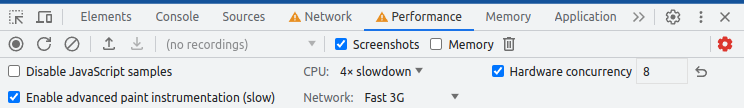
Use the Chrome Performance Panel: Open the Chrome developer tools (Ctrl+Shift+I) and select the
performance panel. In the top bar you can select the CPU Throttle (throttle it to 4x slowdown to
emulate a normal mobile device), the Network Throttle (select the fast 3G preset to mimic your
average mobile device), and set the hardware concurrency to 4 or 8 to mimic your average mobile device.
To load Chrome with less memory available (although lowering the network and CPU setting will often do the job) start up Chrome in a Docker container and assign less memory.
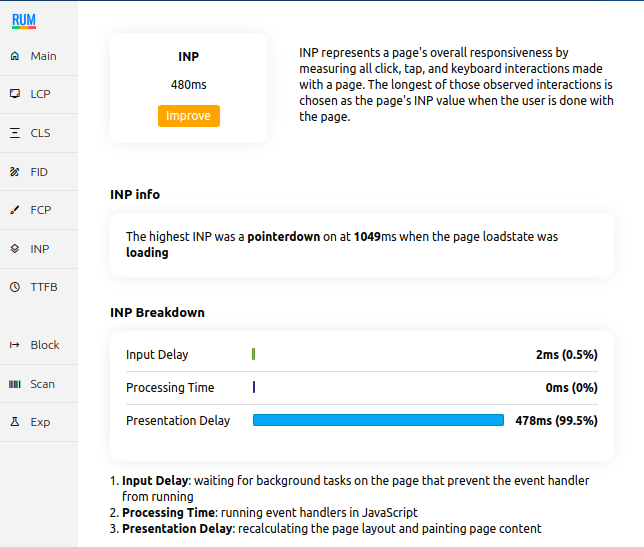
Reload the page, interact and check the INP with the Core Web Vitals visualizer
Now simulate the conditions and confirm the INP scores match what your RUM data reported.
Reload page and click on the right element at the right time
Debug the INP with a performance trace
This is the moment you have been preparing for in the previous steps. It is time to find out why a certain interaction is causing the bad Interaction to Next Paint score.
Open the Chrome Developer Console (Ctrl+Shift+I), navigate to the Performance panel and this time click the Circular Arrow icon to reload the page and start recording (or use the Ctrl+Shift+E shortcut). While the recording is running, interact with the element that causes the bad INP. After a few seconds, stop the recording and examine the timeline. Look for the interaction event in the "Interactions" track, then inspect the corresponding tasks in the "Main" track to see exactly what code is executing during each phase.
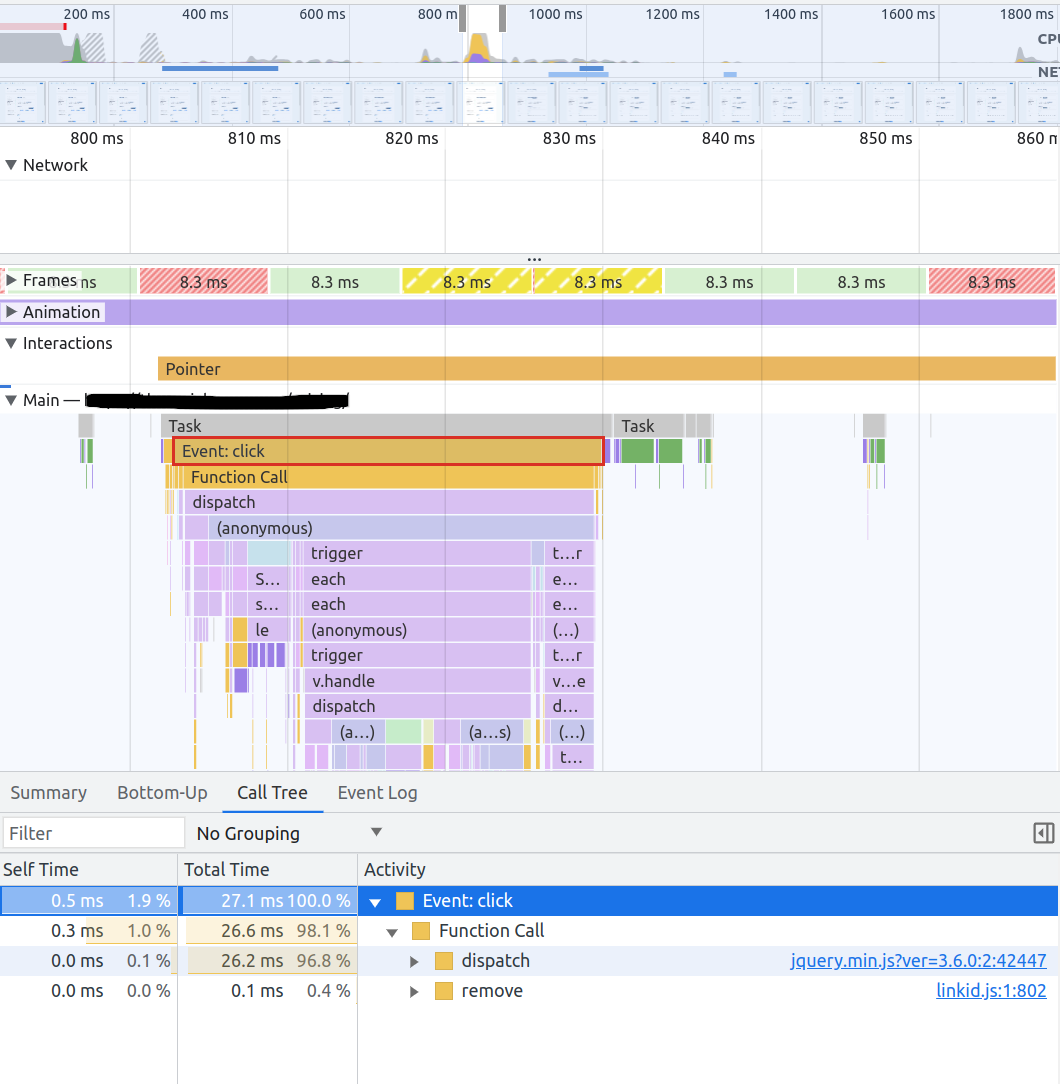
Reading the performance trace
In the Chrome Performance panel, the interaction will appear as a colored bar in the "Interactions" track. Click on it to see the total INP duration and its breakdown. Below, in the "Main" track, you can see the individual tasks that ran during the interaction. Pay attention to:
- Tasks before the event handler: these contribute to input delay
- The event handler itself: this is the processing time
- Rendering work after the handler completes: this is the presentation delay
Compare these findings with your LoAF data to confirm that the scripts identified in the trace match the attribution data from your RUM tool. This is also a good moment to check whether any JavaScript scroll handlers are contributing to the problem.
Step 4: Fix INP issues
You know which interaction is slow and why. Time to fix it. The Interaction to Next Paint can be broken down into 3 phases: input delay, processing time, and presentation delay.
Each phase needs a different approach. Here is a summary. Follow the links for complete optimization guides.
Minimize Input Delay:
Input delay is the time between the interaction with the page and when the event callback begins to run. While some input delay is unavoidable (browsers need time to schedule the callbacks), you can minimize it:
- Avoid long tasks. Whenever a task runs it will block the main thread and leave the event callbacks waiting. This is especially important when optimizing early clicks (since most scripts will be executing at that time). For strategies to reduce JavaScript blocking, see our guide on async vs defer JavaScript.
- Be careful when creating new tasks. For example, recurring tasks via
setTimeout()or tasks that will probably occur before the INP event like callbacks on themouseoverevent. - Measure and assess early interaction. When an interactive element is presented early (for example a site search element) and is controlled by JavaScript that loads later, any interaction with the element will not trigger an immediate layout update. Either prioritize the functionality or hide/disable the element before it is properly working.
- Use web workers to run JavaScript off the browser's main thread. Web workers allow scripts to run off the main thread. This will prevent the main thread from blocking and causing INP input delay issues.
- Load nice-to-have third party scripts during browser idle time. Some scripts are more critical than others. It makes sense to prioritize these scripts and load less important scripts during browser idle time. For example, a chat script. See our guide on 14 methods to defer JavaScript for practical techniques.
Minimize Processing Time
- Remove unneeded code. Unneeded code is either older code that still runs or new code that is not needed on this specific page but still takes up CPU time. This is by far the easiest way to immediately improve the INP.
- Defer code that does not need to run before the next paint. Split up code into critical code that must run before the INP and non-critical code (for example sending analytics) and schedule that after the paint event with the
requestIdleCallback()method. - Optimize code that must run before the paint. Check your code and rewrite slow or ineffective parts.
- Provide immediate feedback. On complicated or possibly slow tasks, provide immediate feedback before running the main code.
Minimize Presentation Delay
- Keep the DOM small and simple. It will be much easier for a browser to render a page with few and simple unnested DOM elements (HTML nodes) than it is to render a page with many nested DOM nodes. Read more about fixing excessive DOM size.
- Use content-visibility to lazy-render off-screen content. Content-visibility will speed up rendering of visible parts of the page by delaying rendering of off-screen content and rendering that off-screen content just in time.
Quick fix: yield to the main thread with scheduler.yield()
Yielding to the main thread between critical and non-critical work improves all three INP phases at once. The scheduler.yield() API provides a clean way to do this. Here is a reusable helper function with a fallback for browsers that do not yet support the API:
async function yieldToMain() {
  if ('scheduler' in window && 'yield' in window.scheduler) {
    return await window.scheduler.yield();
  }
  return new Promise((resolve) => {
    setTimeout(resolve, 0);
  });
}

// Usage in an event handler
async function handleButtonClick() {
  // Critical work: update the UI
  updateVisualFeedback();

  // Yield to let the browser paint
  await yieldToMain();

  // Non-critical work: analytics, logging
  sendAnalyticsEvent('button_click');
  logInteraction();
}
Each INP phase in detail
Each phase has its own optimization strategies:
- Input Delay: Learn how to minimize the time between user interaction and the start of event processing. Input delay is typically the smallest of the three phases, but it spikes during page startup when the main thread is busy with script execution.
- </b>Processing Time: Optimize the event handler code that runs during the interaction. On most pages, this is where the bulk of your optimization effort pays off.
- Presentation Delay: Reduce the rendering and painting work that follows event processing. On complex pages with large DOMs, this is often the largest phase.
For additional strategies that cut across all three phases, see our guides on improving INP by ditching JavaScript scrolling and choosing async vs defer for your JavaScript.
Your Lighthouse score is not the full picture.
Your real users are on Android phones over 4G. I analyze what they actually experience.
Analyze field data
