INP Presentation Delay: DOM Size, Layout Work, and Rendering Optimization
Learn how to find and improve INP issues caused by presentation delay

Interaction to Next Paint (INP) issues caused by presentation delay
This page is part of our Interaction to Next Paint (INP) series. INP measures the total time from a user interaction to the next visual update. Presentation delay is the third and final phase of the INP, following input delay and processing time. If you are new to INP, read our guide on how to identify and fix INP issues first.
In short: The Interaction to Next Paint (INP) measures how long it takes for a user to see a visual change on a page after interacting with it. This INP can be broken down into 3 components: "input delay", "processing time", and "presentation delay."
Presentation delay is the top contributor to the total INP, accounting for roughly 42% of the total INP time on average. Optimizing your rendering pipeline and simplifying your HTML structure is the single biggest lever for improving INP.
Presentation Delay: Ever clicked a button and wondered why it took a split second too long to see the result? That is Interaction to Next Paint (INP) in action. Presentation delay is the last step in the interaction process, kicking in after your click has been processed but before you see any visual changes.
Table of Contents!
- Interaction to Next Paint (INP) issues caused by presentation delay
- Understanding presentation delay
- Presentation delay and the INP
- What causes high presentation delay?
- Reducing presentation delay
- Identifying long presentation delays
- Identifying presentation delay with RUM data
- Measuring presentation delay with Long Animation Frames (LoAF)
- Explore the other INP phases
Understanding presentation delay
The presentation is the final phase of an interaction. Presentation delay represents the time it takes for the browser to render visual updates that follow the interaction. Presentation delay begins when the event handlers for the interaction have finished running and ends when the next frame (containing the visual changes) is painted. The presentation delay can be affected by various factors, including the complexity of the layout, the size of the DOM, and the amount of rendering work required.
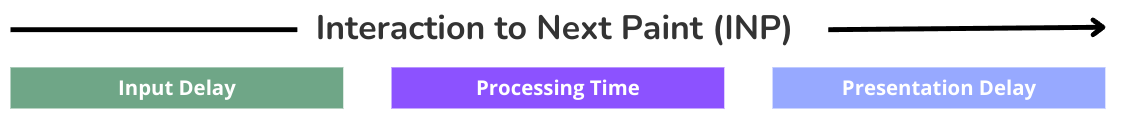
The Interaction to Next Paint (INP) can be broken down into 3 sub-parts: "Input Delay", "Processing Time", and "Presentation Delay".
Presentation delay and the INP
Presentation delay is the last phase of the INP. On average, presentation delay makes up about 42% of the total INP time, making it the single largest contributor to slow interactions.
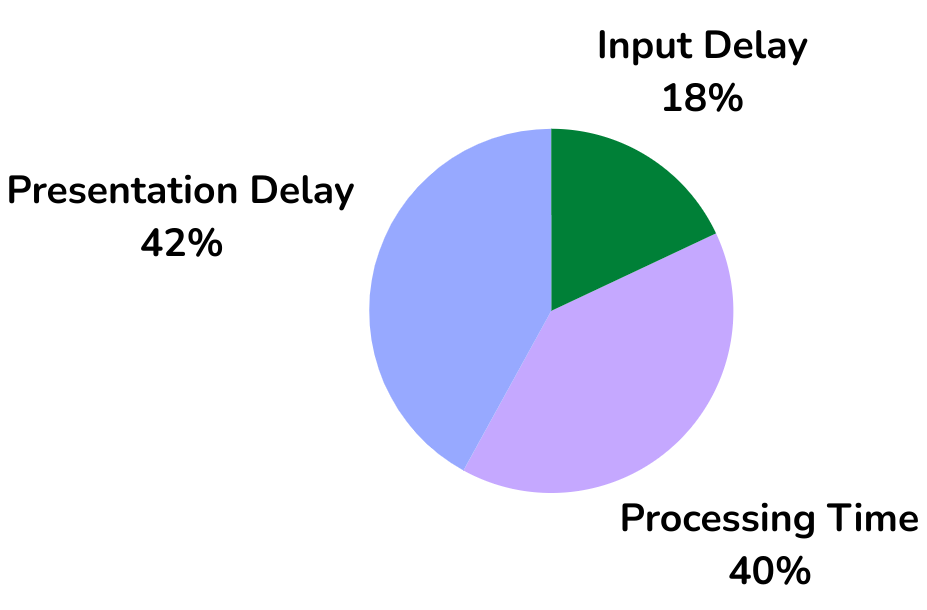
At CoreDash we collect millions of Core Web Vitals data points each hour. Based on that data, the presentation delay accounts for 42% of the Interaction to Next Paint. This is more than processing time (40%) and significantly more than input delay (18%). Despite being the largest contributor, presentation delay is often the hardest phase to optimize because it involves the browser's rendering pipeline rather than your application code.
Presentation delay example: Imagine you are on your phone browsing an e-commerce website for a new pair of shoes. You tap on a product image to see more details. However, your phone is a bit older and struggles to keep up.
You tap on the image (Interaction). The phone takes some time to process the request and update the display (Processing Time). The website needs to render the new page with the larger image and details. Finally, it takes a noticeable amount of time for the new product details and image to appear on your screen (Presentation Delay). This delay in the INP can be frustrating for users and that is why it is important to fix it.
What causes high presentation delay?
Presentation delay encompasses all the work the browser does after your event handlers finish and before pixels appear on screen. This includes style recalculation, layout computation, painting, and compositing. Several factors contribute to high presentation delay:
Large DOM size
A large or deeply nested DOM is one of the most common causes of high presentation delay. Every time the browser needs to update the visual state of the page after an interaction, it must recalculate styles, compute layout, and repaint the affected elements. The cost of each of these steps scales with the number of DOM nodes that are affected.
Google recommends keeping your DOM under 1,400 elements, with a maximum depth of 32 levels and no more than 60 child elements per parent node (see the Lighthouse DOM size audit). When your DOM exceeds these thresholds, the browser spends much more time on style recalculation and layout computation after each interaction.
Consider this scenario: a user clicks a button that toggles a CSS class on a container element. If that container has 5,000 descendant nodes, the browser must recalculate styles for potentially all of them, even if only a few elements actually change visually. This style recalculation happens synchronously before the next paint, directly increasing presentation delay.
For specific techniques to reduce your DOM, read our guide on fixing excessive DOM size.
Excessive layout work
Layout (also called "reflow") is the process where the browser calculates the position and dimensions of every visible element on the page. After an interaction that modifies the DOM or changes CSS properties that affect geometry (width, height, margin, padding, top, left), the browser must perform layout before it can paint the updated frame.
Two patterns are particularly harmful to presentation delay:
Forced synchronous layout occurs when JavaScript reads a layout property (like offsetHeight or getBoundingClientRect()) after making a DOM change that invalidates layout. The browser is forced to perform layout synchronously, within your event handler, to return an accurate value. This layout work then becomes part of processing time, but any subsequent layout triggered by further DOM changes becomes part of presentation delay.
Layout thrashing is the repeated pattern of writing to the DOM and then reading layout properties in a loop. Each read forces the browser to recalculate layout, and each write invalidates the layout again. This can cause dozens or even hundreds of unnecessary layout calculations per interaction. Here is an example of layout thrashing and how to fix it:
// BAD: Layout thrashing inside a loop
function resizeItems() {
  const items = document.querySelectorAll('.item');
  items.forEach(item => {
    // Read (forces layout)
    const parentWidth = item.parentElement.offsetWidth;
    // Write (invalidates layout)
    item.style.width = parentWidth + 'px';
  });
}

// GOOD: Batch reads, then batch writes
function resizeItems() {
  const items = document.querySelectorAll('.item');
  // Read all values first
  const widths = Array.from(items).map(
    item => item.parentElement.offsetWidth
  );
  // Then write all values
  items.forEach((item, i) => {
    item.style.width = widths[i] + 'px';
  });
}
Client-side rendering in Single Page Applications
Client-side rendering of HTML can significantly impact presentation delay, particularly in Single Page Applications (SPAs). When a user interaction triggers a route change or a large UI update, the SPA framework must:
- Run the virtual DOM diffing algorithm to determine what changed
- Apply the resulting DOM mutations to the real DOM
- Trigger style recalculation and layout for all affected elements
- Paint the updated frame
In React applications, the virtual DOM reconciliation process is part of processing time, but the resulting DOM mutations and their rendering cost fall into presentation delay. The more DOM nodes your component tree produces, the more expensive the reconciliation and the subsequent rendering work.
To mitigate this in React and Next.js applications:
- Use
React.memo()to prevent unnecessary re-renders of child components that receive the same props. - Use
useDeferredValue()for values that trigger expensive re-renders, allowing React to prioritize more urgent updates. - Keep component trees shallow. Deeply nested component hierarchies produce deeply nested DOM, which increases the cost of both reconciliation and browser rendering.
- Use virtualization libraries (like
react-windowor@tanstack/react-virtual) for long lists so the DOM only contains the visible items.
Reducing presentation delay
Minimize DOM size
The biggest win for presentation delay is keeping your DOM small:
- Remove unused HTML elements, especially deeply nested wrapper divs.
- Use list virtualization for long lists (render only visible items plus a small buffer).
- Flatten deeply nested structures where possible.
- Use CSS Grid and Flexbox instead of nested divs for layout.
// Virtualize long lists to reduce DOM size
// Before: 10,000 items in the DOM

<ul>
  {allItems.map(item =>
     <li key="{item.id}">{item.name}</li>)
   }
</ul>

// After: only visible items in the DOM (using react-window)
import { FixedSizeList } from 'react-window';
<fixedsizelist height="{600}"
               itemcount="{allItems.length}"
               itemsize="{50}" width="100%">
  {({ index, style }) => (
    <div style="{style}">{allItems[index].name}</div>
  )}
</fixedsizelist>
Use content-visibility to lazy-render off-screen content
The CSS content-visibility property tells the browser to skip rendering of off-screen content until the user scrolls near it. This reduces the amount of rendering work during interactions by limiting the scope of style recalculation and layout to the visible portion of the page.
/* Apply content-visibility to sections below the fold */
.below-fold-section {
  content-visibility: auto;
  contain-intrinsic-size: auto 500px;
}

/* Apply to individual items in long lists */
.list-item {
  content-visibility: auto;
  contain-intrinsic-size: auto 80px;
}
The contain-intrinsic-size property provides an estimated height so the browser can calculate scrollbar size correctly without rendering the content. This prevents layout shifts when the user scrolls and the content becomes visible.
For more CSS optimization strategies that reduce rendering cost, see our guide on removing unused CSS.
Minimize layout work triggered by interactions
When designing interactions, prefer CSS properties that do not trigger layout. Properties like transform and opacity can be handled by the GPU compositor without triggering layout or paint. Instead of animating top, left, width, or height, use transform: translate() and transform: scale(). For the full list of CSS properties that trigger layout, see the web.dev rendering performance guide.
Use the CSS will-change property to hint to the browser that an element will be animated. This allows the browser to create a separate compositor layer for the element, isolating its rendering from the rest of the page:
/* Promote elements to their own compositor layer */
.animated-element {
  will-change: transform, opacity;
}

/* Toggle visibility with opacity instead of display */
.modal {
  opacity: 0;
  pointer-events: none;
  transform: translateY(10px);
  transition: opacity 0.2s, transform 0.2s;
}

.modal.active {
  opacity: 1;
  pointer-events: auto;
  transform: translateY(0);
}
Identifying long presentation delays
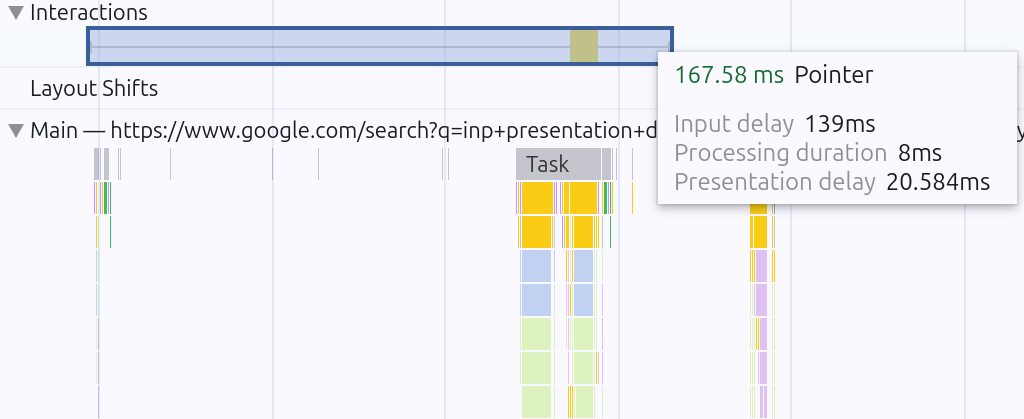
To identify long presentation delays you can use Chrome's performance profiler. Open DevTools (Ctrl+Shift+I), navigate to the Performance tab, hit record, and interact with the page.
You can then analyze the timeline of an interaction and visualize the different phases, including the presentation delay. By examining the rendering updates that occur after the event handlers have finished, you can pinpoint any bottlenecks contributing to a long presentation delay. Look for large "Recalculate Style", "Layout", and "Paint" entries in the timeline. These represent the work the browser does during the presentation delay phase.
Identifying presentation delay with RUM data
Measuring presentation delay with Long Animation Frames (LoAF)
The Long Animation Frames (LoAF) API shows exactly what causes rendering delays during user interactions. The API gives you timing data to separate processing time from presentation delay and pinpoint which scripts slow down rendering.
The key LoAF properties for understanding presentation delay are:
renderStart: when the browser began the rendering phase (style recalculation, layout, paint)styleAndLayoutStart: when style and layout computation beganduration: total duration of the long animation frameblockingDuration: how much of the frame was blocked by scripts
LoAF is currently Chromium-only (Chrome 123+). For other browsers, use Chrome DevTools Performance panel traces to analyze rendering work.
The difference between the end of script execution and the end of the frame represents the pure rendering cost, which is presentation delay. Here is how to observe and log this data:
// Measure presentation delay using LoAF API
const observer = new PerformanceObserver((list) => {
  for (const entry of list.getEntries()) {
    if (entry.duration > 50) {
      const scriptEnd = Math.max(
        ...entry.scripts.map(s => s.startTime + s.duration)
      );
      const presentationDelay = (
        entry.startTime + entry.duration
      ) - Math.max(scriptEnd, entry.renderStart);

      console.log('Presentation delay breakdown:', {
        totalDuration: entry.duration,
        renderStart: entry.renderStart,
        styleAndLayoutStart: entry.styleAndLayoutStart,
        estimatedPresentationDelay: presentationDelay,
        scriptCount: entry.scripts.length
      });
    }
  }
});

observer.observe({
  type: 'long-animation-frame',
  buffered: true
});
RUM tools like CoreDash integrate LoAF data and show you which scripts and DOM changes cause rendering delays, with full script attribution.
Explore the other INP phases
To get your INP under control, address the other two phases as well:
- Input Delay: Minimize the waiting time before event handlers begin executing. Input delay is typically the smallest phase but spikes during page startup when the main thread is busy.
- Processing Time: Optimize the event handler code that runs during the interaction. On most pages, this is where the bulk of your optimization effort pays off.
For a complete diagnostic workflow, see our guide on how to find and fix INP issues. For additional rendering optimization strategies, explore our guides on fixing excessive DOM size and removing unused CSS. Return to the INP hub page for the full overview.
Find out what is actually slow.
I map your critical rendering path using real field data. You get a prioritized fix list, not a Lighthouse report.
Get the audit
