Fix LCP With an AI Agent: Field Data to Code Fix
The complete LCP diagnosis workflow using CWV Superpowers: from identifying the bottleneck phase in field data to the specific code change.

A slow Largest Contentful Paint has four possible causes. An AI agent connected to field data can identify which one is your actual bottleneck, trace it in Chrome, and generate the fix. This is the full LCP diagnosis workflow using CWV Superpowers.
Last reviewed by Arjen Karel on March 2026
The four LCP phases
Google breaks LCP into four phases. Each one has different causes and different fixes.
TTFB is the time from navigation start to the first byte of the HTML response. Slow servers, missing CDN, no caching, long database queries. If TTFB is the bottleneck, nothing else matters until you fix the server.
Load Delay is the gap between receiving the HTML and the browser requesting the LCP resource. This is the discovery problem. If the LCP image is in a CSS background, loaded via JavaScript, or buried behind a chain of redirects, the browser cannot start fetching it until it discovers it needs it.
Load Time is how long the LCP resource takes to download once requested. Large images, missing compression, slow CDN, no responsive srcset.
Render Delay is the gap between the resource finishing download and the browser actually painting it on screen. Render-blocking scripts, web font loading, or JavaScript that manipulates the DOM before the LCP element becomes visible.
Finding the bottleneck with proportional reasoning
Public data about the Core Web Vitals is not good enough to help you find the real issues with yrou Core Web Vitals. Lighthouse runs a synthetic test on a simulated Moto G Power and reports one LCP time. CrUX aggregates 28 days of real Chrome data into a single p75 value per URL. Neither tells you what to fix.
It get's worse: neither can segment meaningfully. CrUX combines cached pageviews, uncached pageviews, new visits, and page reloads into one p75. Those should be treated as separate problems. Cached pageviews might have a TTFB bottleneck from stale cache validation. Page reloads might hide a resource discovery issue where the browser finds the LCP image late on every visit. The blended p75 masks both.
CrUX added LCP subparts in 2025, which helps. But it is still a 28-ay p75 with no element,viewport, or any filtering. You see the phase proportions for "all visitors to this URL over the last month." You do not see what is happening on the specific device type, country, or page template where the problem lives.
RUM data segments by all of these dimensions. CWV Superpowers queries that segmented data and interprets it proportionally. The bottleneck is the phase consuming the largest share of total time for the specific segment that is failing. Not a meaningless average or a lighthouse simulation. Real data!
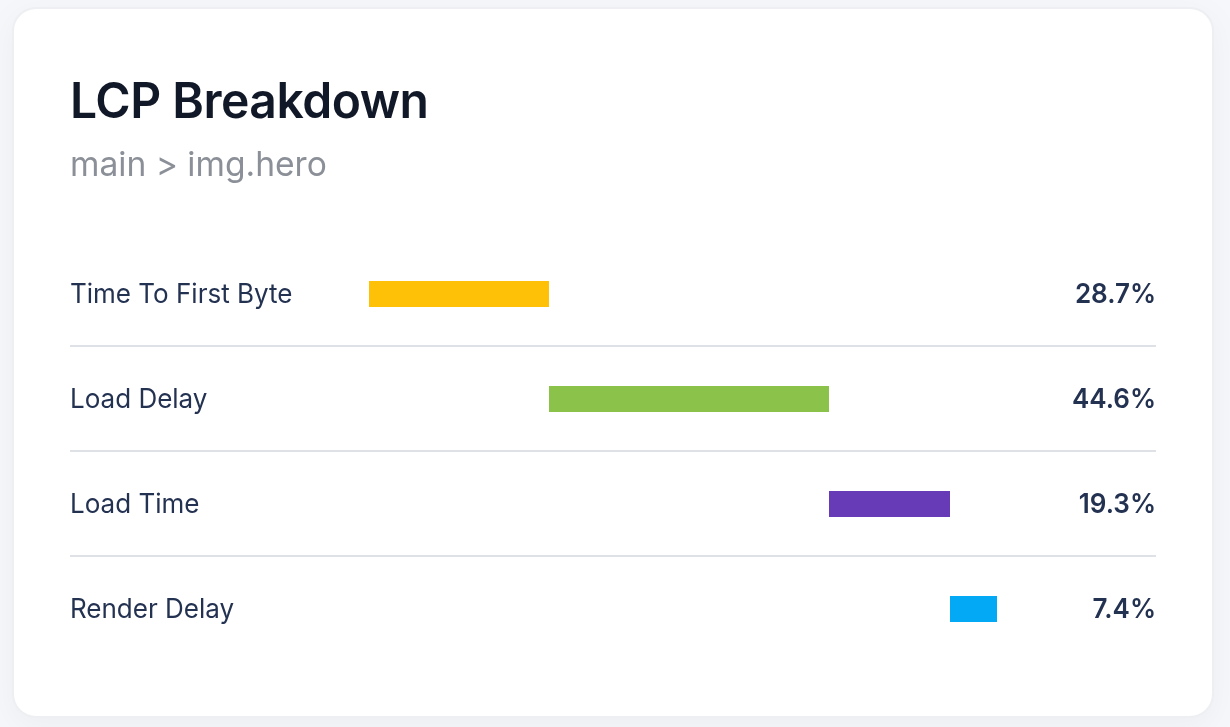
Concrete example. LCP is 3,800ms on mobile product pages. The breakdown from real users for first visitors on cached pageviews:
- TTFB: 600ms (28.7%)
- Load Delay: 1,900ms (44.6%)
- Load Time: 800ms (19.3%)
- Render Delay: 500ms (7.4%)
Load Delay is the obvious bottleneck. Half the total LCP time is the browser waiting to discover the image exists. LightHouse, CrUX or manual investigation would have had a real hard time finding this exact combination of visitor characteristics that caused this issue.
For a full explanation of this approach, see proportional reasoning for web performance.
Why the browser finds your image late
Load Delay is the most common LCP bottleneck I see. It means the browser received the HTML but did not know it needed the hero image until much later.
Three common causes. The image is a CSS background image invisible to the preload scanner. The image URL is constructed in JavaScript. Or the image is technically in the HTML but has a lazy loading attribute that the browser respects too eagerly.
Open the Chrome trace. You will see a fat gap in the network waterfall between the HTML arriving and the image request firing. That gap is your Load Delay. On the sites I audit, it is 1,500 to 2,500ms on mobile. Two full seconds where the browser has the HTML but has no idea it needs the hero image.
The agent sees the same gap. It matches the waterfall to the CoreDash breakdown and tells you exactly why the image was late.
What the diagnosis looks like
This is what the output looks like:
AI Cause Identified: The LCP image div.hero-banner > img.product-main on /product/running-shoes-42 is discovered 1,980ms late because it lacks a preload hint and has no fetchpriority="high". CoreDash data: LCP is 3,820ms (poor) on mobile, p75. Load Delay is the bottleneck at 52% of total. Chrome trace confirms: 1,940ms gap between HTML first byte and image request in the network waterfall.
That is the entire diagnosis. The agent found the file, wrote the diff. You check it and ship.
Typical fixes by phase
Load Delay: Add a preload hint in the <head>. Set fetchpriority="high" on the LCP image. Move the image from CSS background or JavaScript into HTML where the preload scanner can find it.
Load Time: Convert to WebP or AVIF. Reduce image dimensions to match actual display size. Add responsive srcset so mobile users do not download a desktop-sized image. See optimizing images for Core Web Vitals.
Render Delay: Remove or defer render-blocking scripts that execute before the LCP element becomes visible. Check font-display on web fonts affecting the LCP text element. Use 103 Early Hints to deliver CSS earlier.
TTFB: Add a CDN. Enable server-side caching. Reduce database query time. Use 103 Early Hints to let the browser start preloading resources while the server is still generating the response.
Verifying the fix
After deploying, query CoreDash field data for the same page and device segment. Field data updates as real users load the page. I typically check after 24 to 48 hours of traffic. The LCP p75 should drop, and the bottleneck phase distribution should shift.
This is the difference between fixing a number and fixing the experience. You do not wait 28 days for a CrUX update or re-run Lighthouse and hope the score went up. You see the improvement in real user numbers, on the device and network segments where the problem was.
For INP diagnosis (the metric that cannot be measured in a lab), the same segmented workflow applies. For a broader look at how AI agents use field data vs lab data across all three Core Web Vitals, see AI agent Core Web Vitals debugging.
Search Console flagged your site?
I deliver a prioritized fix list backed by field data. Not a 50 page PDF.
Request audit
