Render-blocking requests in Lighthouse: how to fix them
Lighthouse 13 lists every stylesheet and script your page waits for before it paints, the fast ones included. When that costs your visitors time, and which CSS fixes work.

Do render-blocking requests hurt my score?
Lighthouse lists every stylesheet and script your page waited for before its first paint in the Render-blocking requests insight ("Requests are blocking the page's initial render, which may delay LCP"), called "Eliminate render-blocking resources" before Lighthouse 13. The insight doesn't count toward your score, but while the page waits for its CSS and scripts it stays white, which delays FCP and LCP, most of all on a phone. Trim and combine your CSS and defer your scripts.
Table of Contents!
What does the Render-blocking requests insight check?
Lighthouse's description says: "Requests are blocking the page's initial render, which may delay LCP. Deferring or inlining can move these network requests out of the critical path." Inlining isn't the fix: see below. The table has three columns: URL, Transfer Size and Duration. Transfer Size is the file as it was sent, compressed. Duration is Lighthouse's estimate of how long the request takes on a slow phone, a new connection to another domain included.
While Chrome loads a page, it marks every request as render-blocking or not and writes that into its trace. Lighthouse reads the trace and lists every request in the main frame that Chrome marked as blocking and that finished before the first paint. In practice that is the stylesheets and synchronous scripts in the <head> and the files they pull in with @import. A stylesheet in the body only counts at Chrome's highest priority, a script at high priority; after the first image both drop lower and are skipped. There is no threshold: one listed file fails the insight.
Some files never show up, even when they slow the page down: async scripts, files a script adds to the page (gtm.js, gtag.js), inline styles and scripts, anything in an iframe, and fonts.
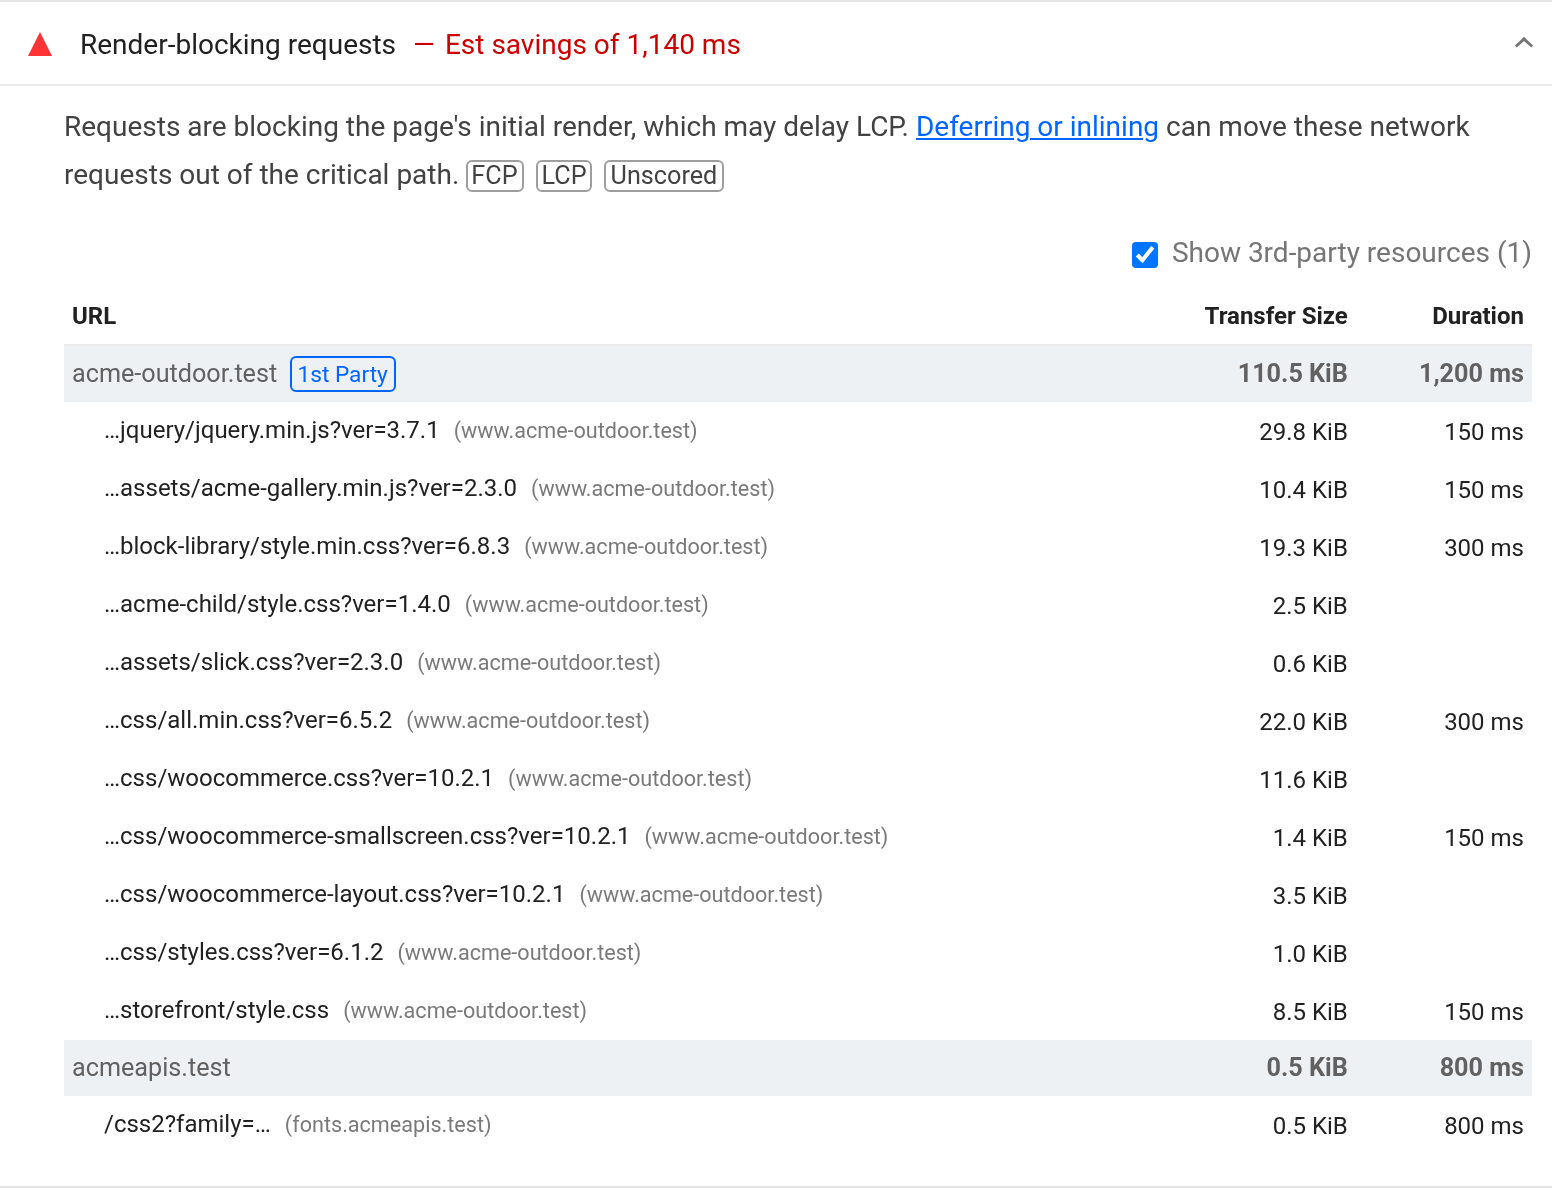
The insight on a WooCommerce product page, Lighthouse 13.5.0, simulated throttling as in PageSpeed Insights.
What makes a file render-blocking?
Render-blocking means the browser paints nothing until that file is in: every stylesheet in the <head> has to arrive and every synchronous script there has to download and run.
- A script after a stylesheet waits for that stylesheet. Chrome won't run a synchronous script until the CSS above it is in, and the parser waits for the script. Both files can download side by side and you still pay for the CSS and then for the script.
- An
@importstarts late. Chrome's preload scanner finds every link in the HTML at once, but an@importinside a CSS file only when that file has arrived. On the product page below, the imported theme stylesheet started at 1.28 s, against 0.59 s when it was linked from the HTML. - Another domain costs a connection. A stylesheet on fonts.googleapis.com or a CDN needs DNS, TCP and TLS before its first byte arrives.
| In Chrome | Holds the first paint? |
|---|---|
<link rel="stylesheet"> in the head | Yes |
the same with fetchpriority="low" | Yes |
the same with media="print" | No, still downloaded |
rel="preload" plus a stylesheet link to the same file | Yes |
@import in a blocking stylesheet | Yes, after its parent |
<script src> in the head | Yes |
async | No, but it can run before the paint |
defer, type="module" | No |
| a stylesheet in the body | Only the content below it |
Do render-blocking requests affect FCP and LCP?
I measured it on a WooCommerce product page with nine stylesheets and two scripts in the head, on a phone over Slow 4G. In the fixed version the CSS is trimmed and combined into one stylesheet of 6.6 kB and both scripts are deferred. Once loaded it looks exactly the same.
FCP
The original painted first at 2.12 s, the fixed version at 1.39 s.

Before

After
Both versions at 1.4 s on the throttled phone: the original is still white.
LCP
LCP can't come before the first paint. Here the LCP element is the product photo, and it can't appear before the CSS is in either: LCP went from 2.25 s to 1.91 s with the fix. In an LCP breakdown that wait shows up as element render delay. Lighthouse doesn't show this: with an image as the LCP element it always estimates the LCP saving at 0 ms, so don't read that as no effect on LCP.
How many sites are affected and is it safe to ignore?
Almost all of them. State of CWV checks the home pages of 114,526 sites with CrUX data: 92.8% have at least one render-blocking request, 91.2% a blocking stylesheet and 62.5% a blocking script. Where they have them, the median is 8 requests and 110 kB, and one site in five has more than 20. (State of CWV counts stylesheets and synchronous scripts in the head, a close match to Lighthouse's list.)
Sites with many of them do worse in the field. 84.0% of the sites without any have a good FCP on phones, against 54.1% of the sites with more than 20. But the server explains most of that drop: over the same range the median TTFB doubles, from 538 ms to 1,114 ms. Split by server speed:
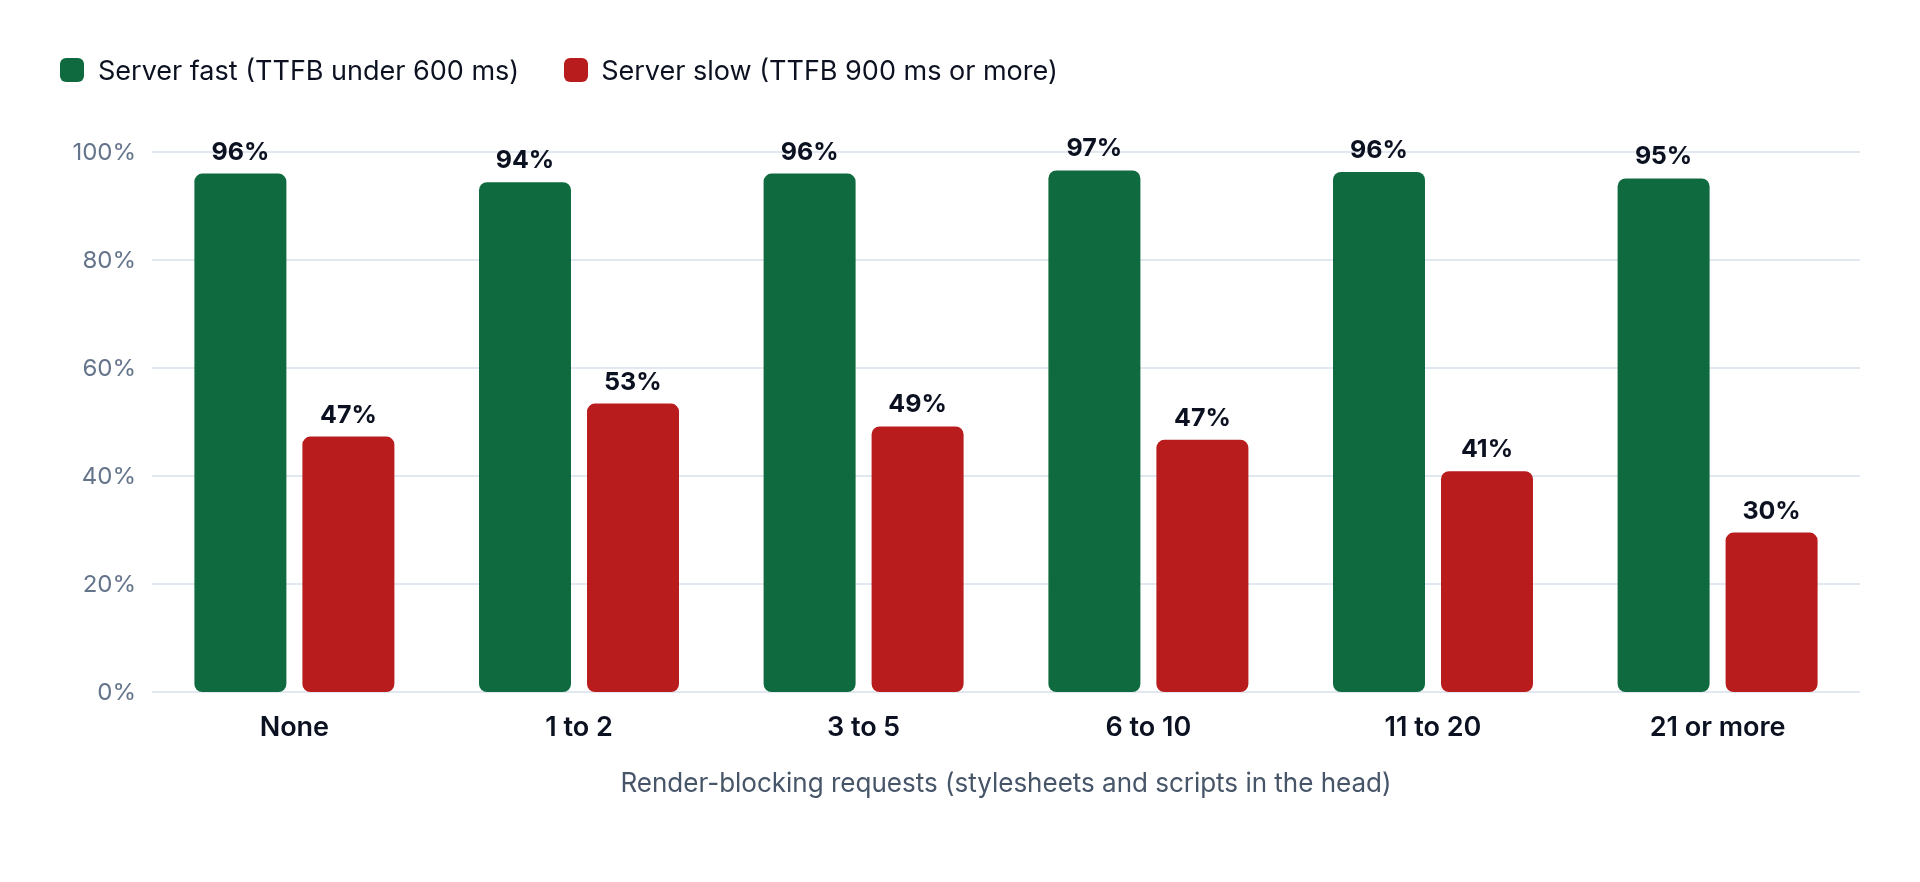
Sites with a good FCP on phones by number of render-blocking requests and server response time. State of CWV, October 2026, CrUX p75 on phones, good FCP is 1.8 s or less.
- Fast server (TTFB under 600 ms): 94 to 97% have a good FCP, whatever the count. The time is still there: from first byte to first paint takes about 150 to 200 ms longer with 21 or more blocking requests than with none.
- Slow server (TTFB 900 ms or more): a good FCP drops from about half the sites (47 to 53%) with up to two blocking requests to 30% with 21 or more. With a TTFB of 900 ms or more, less than 0.9 s is left before the 1.8 s limit for a good FCP, so every extra request the paint waits for can push FCP over.
WordPress sites have more of them: 57% have 16 or more blocking requests (median 19, 163 kB). At the same server speed, that costs 3 points of good FCP against one to five requests on a fast host, and about 10 points on a slow one.
That is a correlation, but it sets the order: with a slow TTFB, fix the server first. On a fast server the 150 to 200 ms is still worth taking when it's your own CSS. You can leave the notice alone when:
- Lighthouse lists only one or two small stylesheets of your own, each under about 15 kB;
- the listed file is a consent tool, an A/B test snippet or a platform file you can't change (see below).
How do you spot render-blocking requests in your field data?
Lighthouse loads your page once, cold. After their first page your visitors have the CSS in their cache, so in the field the cost shows mostly on the first page a visitor loads. In CoreDash look at two things on mobile:
- FCP next to TTFB. Render-blocking files cost their time between the first byte and the first paint. A template where that gap is larger than on the others loads more of them.
- LCP render delay. Look for templates where render delay is a large part of LCP. Blocking CSS is one cause of that wait; DevTools (next section) shows whether that page has any.
CrUX has the same metrics at p75 for your origin or a URL, without telling you which template is slow.
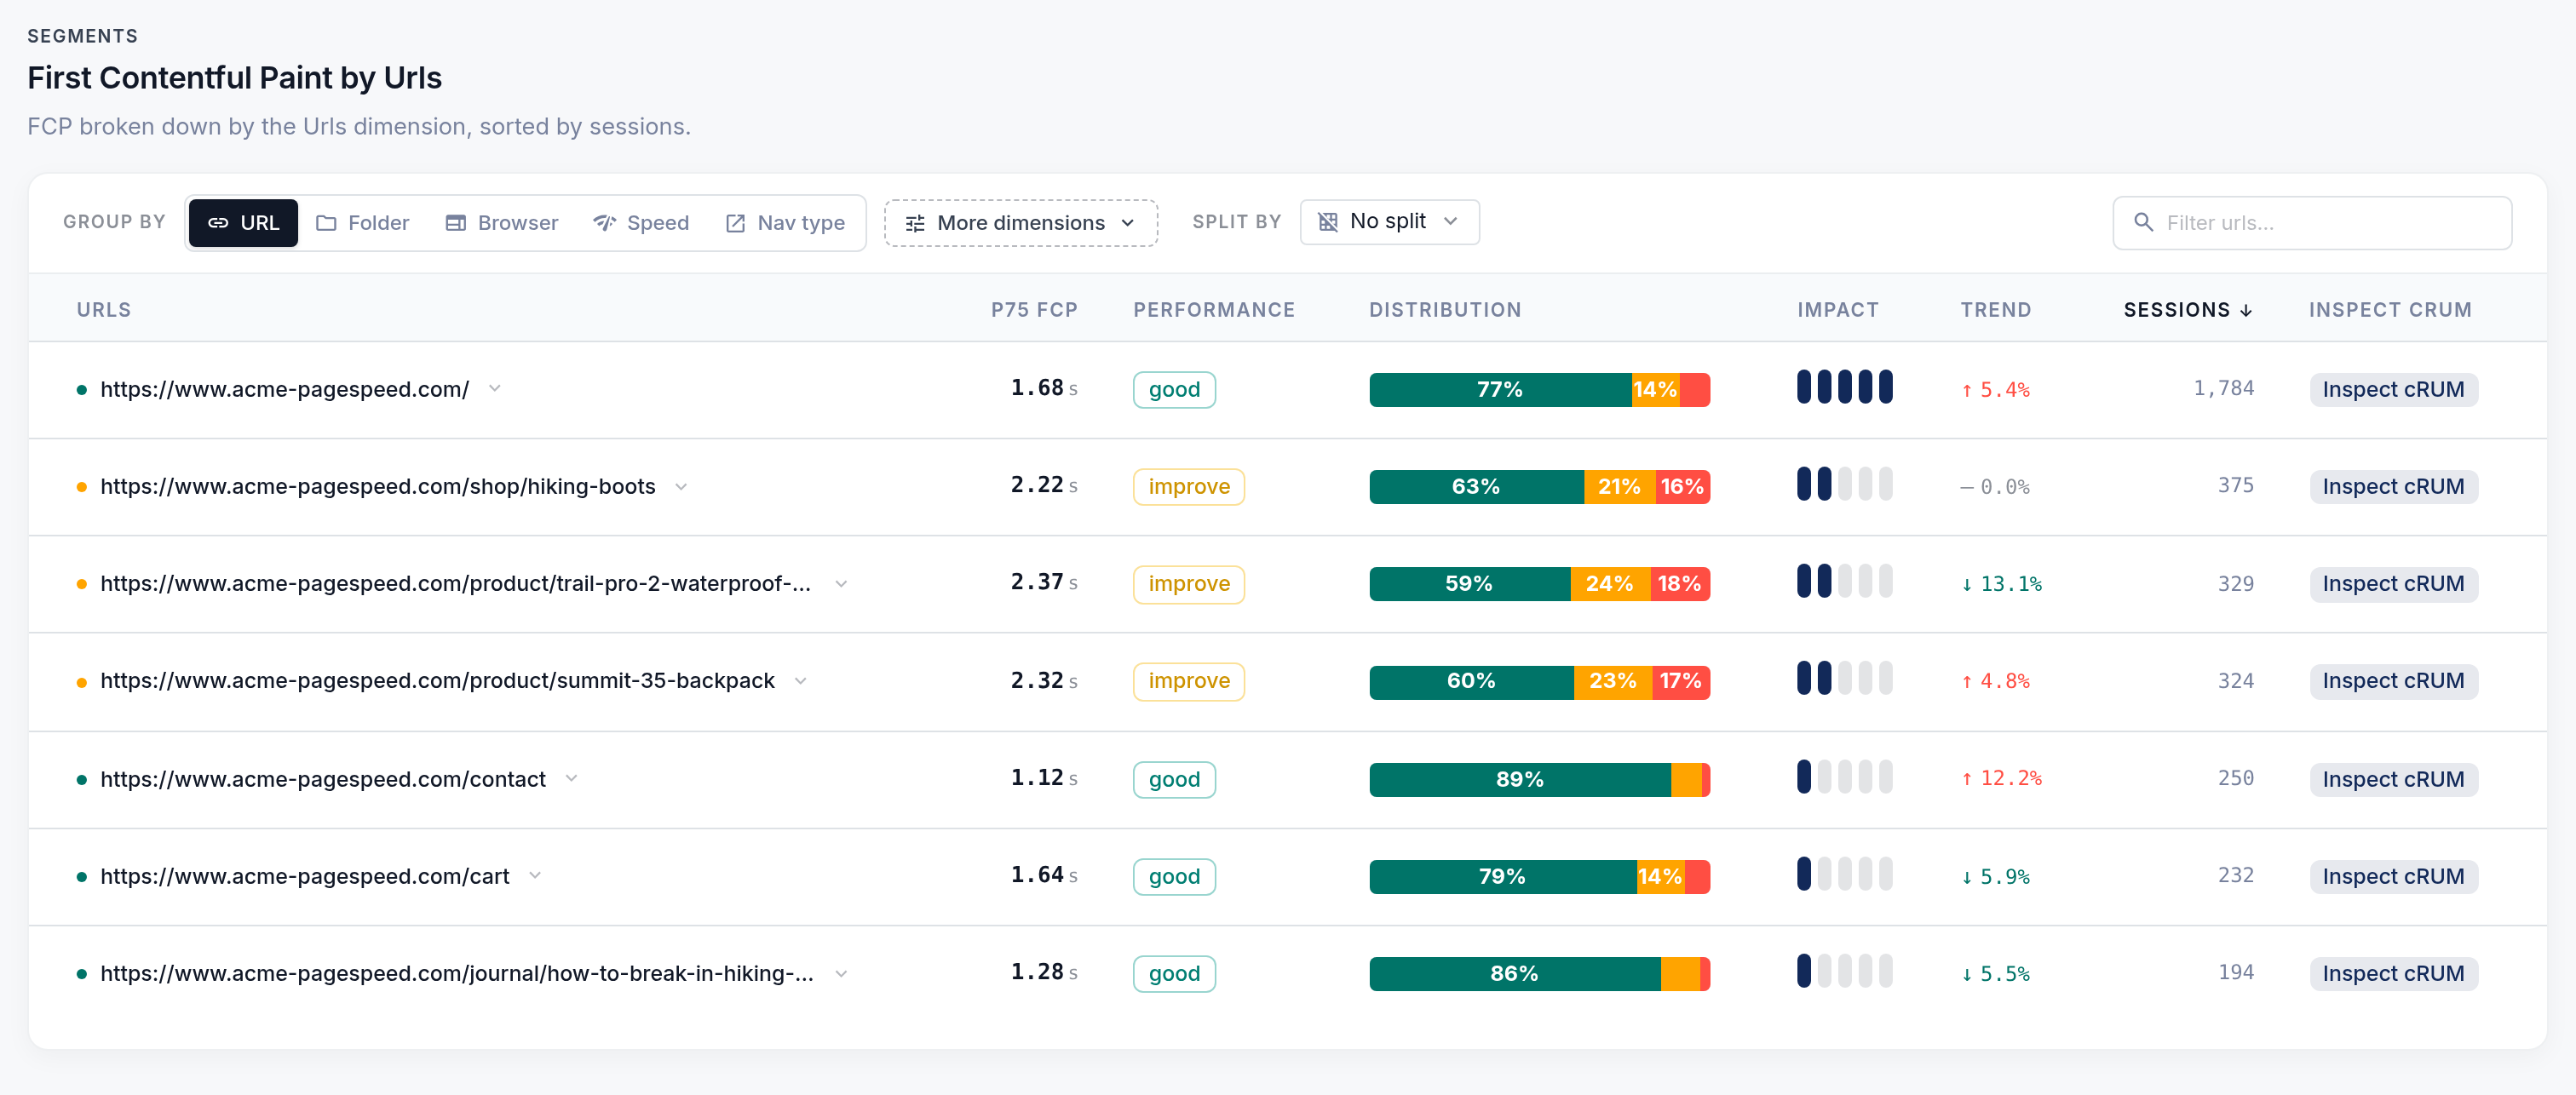
CoreDash on an example shop, acme-pagespeed.com, mobile, p75: the product and category pages are the slow ones.
How do you find the blocking files in DevTools?
Open the page in Chrome, go to the Performance panel, set the network to Slow 4G and the CPU to 4x slowdown, and record a reload. The Insights sidebar lists Render-blocking requests. Click it and DevTools outlines each blocking request in the Network track.
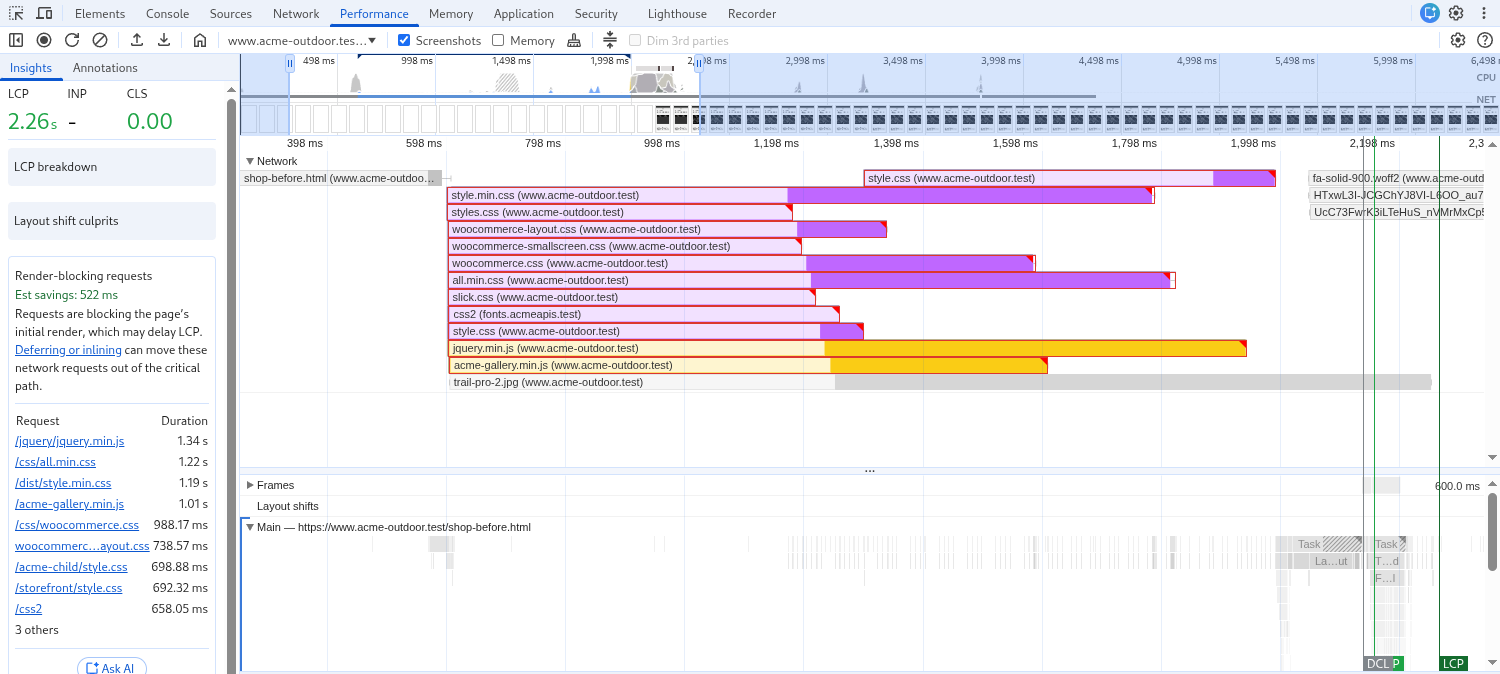
Each bar runs from the moment the request started until its last byte arrived. Look for the request that ends last before the FCP marker: the paint waited for that one. A CSS request that only starts when another one ends is an @import. When nothing blocks, the sidebar says "No render-blocking requests for this navigation".
How do you fix render-blocking requests?
The URL in the Lighthouse table tells you where each file comes from, and that decides where you change it.
Your own CSS and scripts
In your own templates, aim for this head: one small, trimmed stylesheet and every script deferred. Then the first paint waits for only that one file.
<link rel="stylesheet" href="/css/main.min.css">
<script src="/js/jquery.min.js" defer></script>
<script src="/js/gallery.min.js" defer></script>
How to get there is further down, starting with Trim and combine the CSS.
WordPress
Files under /wp-content/plugins/ belong to a plugin, /wp-content/themes/ to your theme and /wp-includes/ to WordPress itself.
If you don't write code, use an optimisation plugin, with these settings:
- Switch on deferring the scripts: Load JavaScript deferred in WP Rocket, Defer JavaScript in Perfmatters, Load JS Deferred in LiteSpeed Cache. A deferred script no longer holds the first paint. jQuery needs care, see below.
- Leave Load CSS Asynchronously and critical CSS off, whatever the old WordPress tip under this insight says about plugins that "inline critical assets". Critical CSS works, but the rest of the CSS arrives after the first paint, so the page styles itself twice and often shifts. What inlining costs on top of that is under Trim and combine the CSS.
- Leave Remove Unused CSS off (Generate UCSS in LiteSpeed Cache). It builds a separate CSS for every URL (WP Rocket puts it inline in the HTML) and keeps only the rules it finds on the page as it loads, so an element a script changes later (an opened menu, a slider) can lose its styles. WP Rocket has a whole guide for the display problems it causes. That is more trouble than it is worth: trim and combine the stylesheets yourself. It takes more work, and it pays for itself.
Many plugins load their CSS on every page, including pages where they do nothing: Contact Form 7 on pages without a form, WooCommerce outside the shop. Every stylesheet WordPress prints has an id such as contact-form-7-css: the part before -css is the handle you use to remove it where it isn't used:
add_action( 'wp_enqueue_scripts', function () {
  if ( ! is_page( 'contact' ) ) {
    wp_dequeue_style( 'contact-form-7' );
  }
}, 20 );
WooCommerce has its own filter for its three stylesheets, woocommerce_enqueue_styles. For your own scripts, WordPress 6.3 and later can add defer:
wp_enqueue_script( 'acme-gallery', get_stylesheet_directory_uri() . '/js/gallery.min.js', array( 'jquery' ), '2.3.0', array( 'strategy' => 'defer' ) );
WordPress drops that defer again, without a warning, when a script that depends on yours is still blocking, or when an inline script is added after it. Check the script tag in the page source.
Defer jQuery only with a tool that also handles the inline jQuery(...) calls. WordPress registers jQuery without defer, so it blocks the head as soon as anything depends on it, and adding defer by hand breaks every inline jQuery(...) call that runs before it. WP Rocket's Load JavaScript deferred defers jQuery and wraps those inline calls. Perfmatters' Defer JavaScript leaves jQuery out until you switch on Include jQuery; when you do, click through the page (menu, gallery, cart) to check that nothing broke.
A child theme whose style.css starts with @import url("../storefront/style.css") builds an @import chain. Remove that line and load the parent stylesheet with wp_enqueue_style.
Shopify
Apps add their files through app embeds (Online Store, Edit theme, App embeds). An embed's script file loads async (unless its Liquid writes its own script tag), its stylesheet blocks. Switch off the embeds you don't use, and after uninstalling an app, search theme.liquid and the snippets for the code it left behind.
Themes load their CSS with the stylesheet_tag filter in theme.liquid, which writes a blocking link. For the one base stylesheet that is fine. The script_tag filter writes a script without defer, so write that tag yourself:
<!-- blocks the first paint -->
{{ 'gallery.js' | asset_url | script_tag }}

<!-- doesn't -->
<script src="{{ 'gallery.js' | asset_url }}" defer></script>
Shopify already sends 103 Early Hints for up to 10 render-blocking files in the head, so those files start early anyway; what you can still change is how many there are and how big. Expect the accelerated checkout stylesheet to stay on the list (see below).
Next.js
In the App Router every CSS import becomes a stylesheet link at the top of the head, and React doesn't paint until it has loaded. Next.js merges them into a few chunks, so the fix is less CSS. Move CSS that only some routes use out of the global CSS into CSS Modules: global CSS imported in the root layout goes to every route, a CSS Module only to the routes that import it. More on how Next.js builds its CSS files.
Next.js loads its own scripts async or deferred. A blocking script on a Next.js site is one somebody added to the layout by hand. Load it with next/script, which by default loads it only once Next.js has started hydrating the page:
import Script from 'next/script'

<Script src="https://example.com/widget.js" strategy="afterInteractive" />
Google Fonts and other domains
The Google Fonts link is a blocking stylesheet on fonts.googleapis.com, and the font files come from a second domain, fonts.gstatic.com. Lighthouse gave that 0.5 kB file the longest Duration: it counts the new connection. Host the fonts yourself and put the @font-face rules in your own stylesheet, and the request and both connections are gone. On Next.js, next/font already does this.
Consent tools, A/B tests and other files to leave alone
- A consent tool with auto-blocking (Cookiebot, OneTrust's OtAutoBlock, the Usercentrics autoblocker): it has to run before every other script to stop them, so it is synchronous by design. The alternative is manual mode, where you mark up every cookie script yourself. Whether that is worth the work is a legal question first. A preconnect to the tool's domain at least starts the connection early.
- An A/B testing snippet (Optimizely, AB Tasty, Convert): synchronous on purpose, so visitors don't see the original flash before the variant. Remove it when no test is running.
- Shopify's content_for_header: every theme needs it and you can't edit it. On all five stores checked for this page it added a blocking stylesheet for accelerated checkout, accelerated-checkout-backwards-compat.css. Leave it.
Trim and combine the CSS
Keep the render-blocking CSS to a few stylesheets, each under about 15 kB compressed. 15 kB is roughly what a new connection delivers in its first round trip.
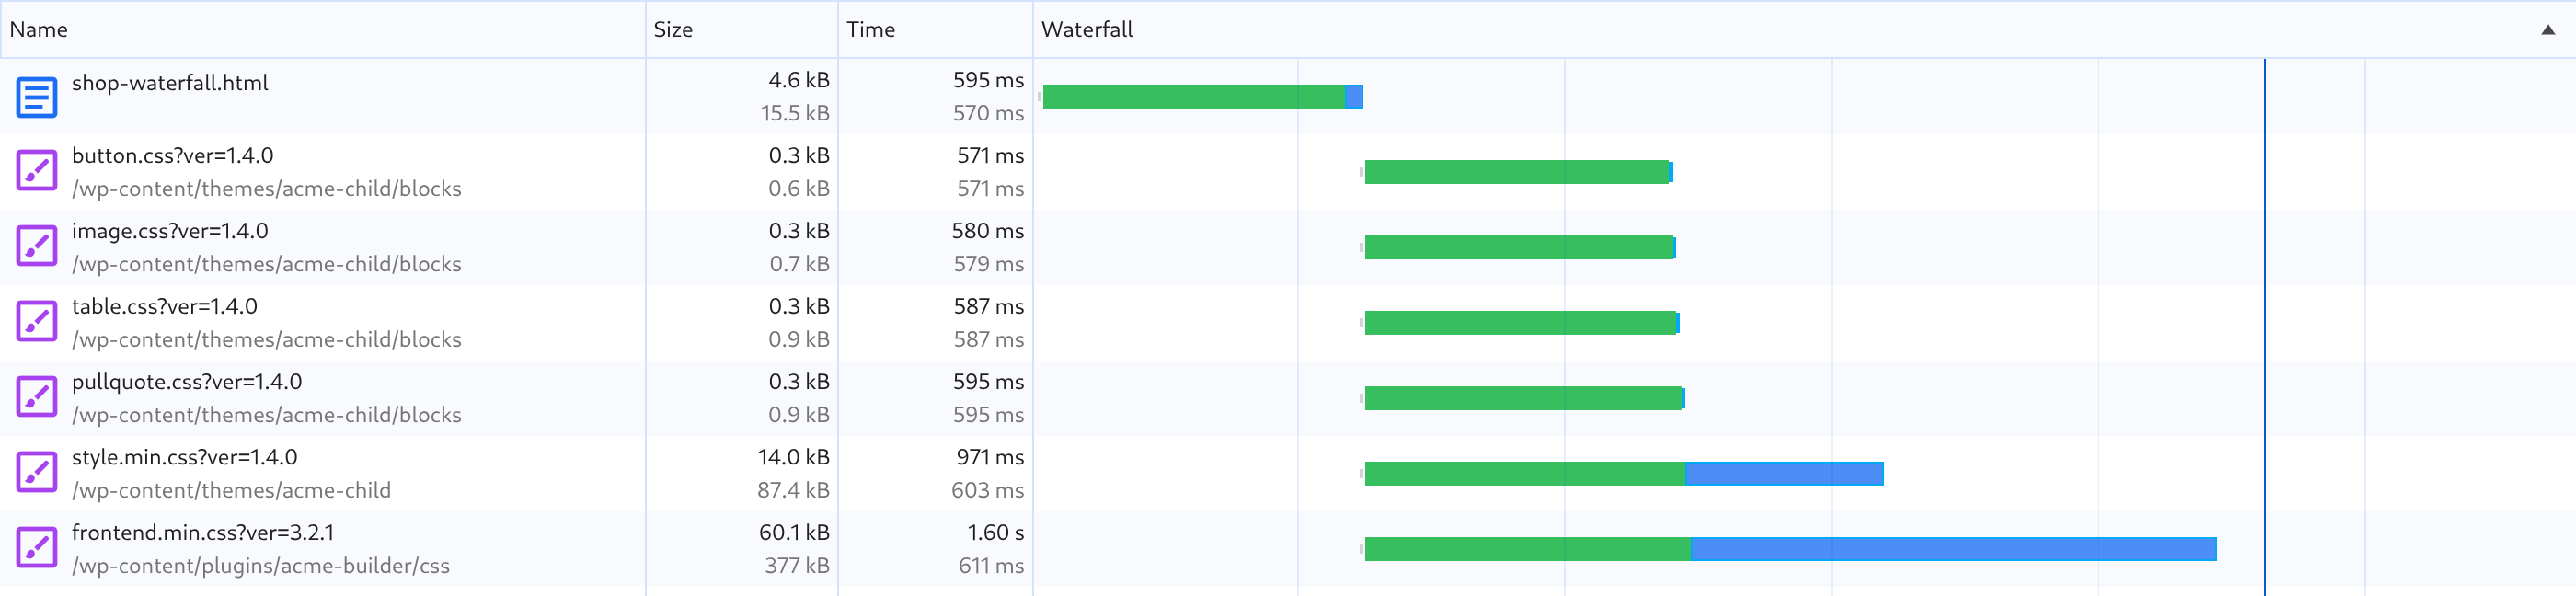
Six render-blocking stylesheets on Slow 4G in the DevTools Network panel. Green is the wait for the first byte, the same for every file. Blue is the download, which grows with the file size.
- Combine the tiny files your theme and plugins add. Every stylesheet waits a full round trip before its first byte arrives, about 0.6 s on Slow 4G, whatever its size. A 0.3 kB file pays that whole wait for almost nothing.
- Trim or split a big file. After the same wait, the 14 kB file was in 0.4 s later. The 60 kB file needed another second to download, and the page stayed white until it was in.
- Remove the rules the page doesn't use. The Coverage tab in DevTools shows per file how much of the CSS the page never uses. On the median site that is 89% (State of CWV, Chrome's coverage of the home page).
- Don't put all the CSS in one big file. All the CSS, untrimmed, in one 68 kB file painted later than the nine separate files. The big file shared the bandwidth with the deferred scripts and the hero image, while with nine files the render-blocking requests got most of it.
- Don't inline the CSS. Inline CSS goes into the HTML, and the HTML is the first file the browser needs: everything else waits for it. So inlining makes the one file everything waits for bigger and slower. More important, the browser usually can't cache the HTML, so every page view downloads that CSS again, while a separate stylesheet is cached after the first page. Among sites with a TTFB under 900 ms and one to five blocking requests, 95.9% of those without inline CSS have a good FCP, against 90.8% of those that inline more than 300 kB (State of CWV).
- Don't split off "the rest" of the CSS to load later. The old
media="print"trick only works for CSS that is never on the first screen, and you rarely know that for every page and every screen size: guess wrong and the page paints unstyled first.
Replace every @import
Give each imported file its own link in the HTML, or combine it into the parent. Removing the @import on the product page moved the first paint 137 ms forward once the scripts were deferred. With the scripts still blocking it saved 33 ms: jQuery arrived at about the same time as the imported stylesheet, so the paint waited for jQuery either way.
Defer the scripts
Add defer to every script in the head that the first paint doesn't need. Module scripts are deferred already. Async takes a script off the list as well, but it can still run before the first paint and hold the main thread, so defer is the better default. Scripts are the smaller part of this insight today: deferring both scripts gained 24 ms, because the CSS finished later anyway. More in async vs defer, head vs footer JavaScript and 14 methods to defer JavaScript.
Start the main stylesheet early with 103 Early Hints
With 103 Early Hints the server tells the browser which files to fetch while it is still building the HTML. Hint your main stylesheet:
HTTP/2 103
link: </css/main.min.css>; rel=preload; as=style
It pays when your server needs time to build the page. The stylesheet downloads during that time, so the gain is at most your server's think time, and a page served from a CDN cache wins little. Cloudflare has a switch for it (Speed, Settings, Content Optimization) and builds the hints from the Link headers your server sends. Apache 2.4.58 and later have H2EarlyHint.
Check LCP afterwards. With the CSS in early, the fonts it names start early too: on the product page the 156 kB Font Awesome font took bandwidth from the product photo, and LCP came later. Lighthouse keeps the hinted file on its list anyway, with 0.0 KiB. More on 103 Early Hints, and on why a plain preload of a stylesheet you also link doesn't help.
Skip fetchpriority="low" on a stylesheet
A common tip is to give the CSS the first screen doesn't need fetchpriority="low". It's an anti-pattern. In the head, Chrome lowers that stylesheet one step, from highest to high priority, and still waits for it before the first paint. Lighthouse decides what blocks by priority in its simulation, so it treats the file as if it were gone: no Duration, and a faster simulated FCP.
I set it on four stylesheets. Lighthouse with simulated throttling dropped FCP from 2.03 s to 1.60 s and raised the score from 96 to 97. In Chrome the first paint moved from 2,122 ms to 2,114 ms, so your visitors wait as long as before.
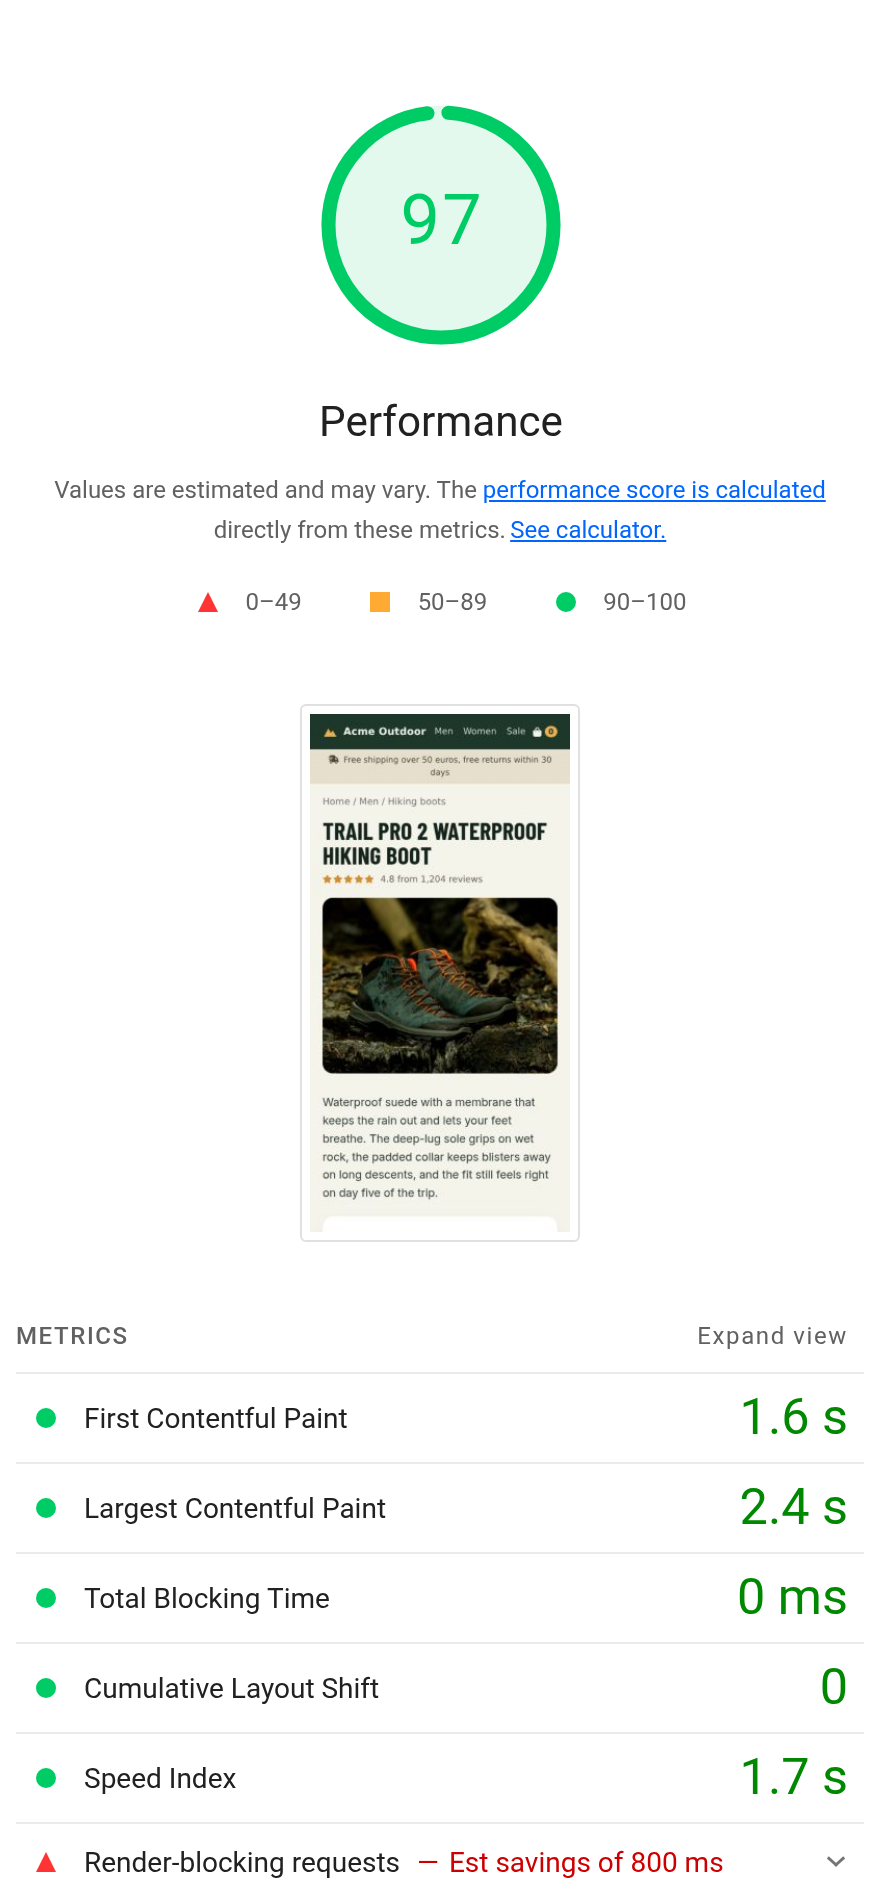
Lighthouse, simulated throttling

Chrome on the phone, same page
At the moment Lighthouse gives as FCP, Chrome still shows a white screen.
How do you check that the fix worked?
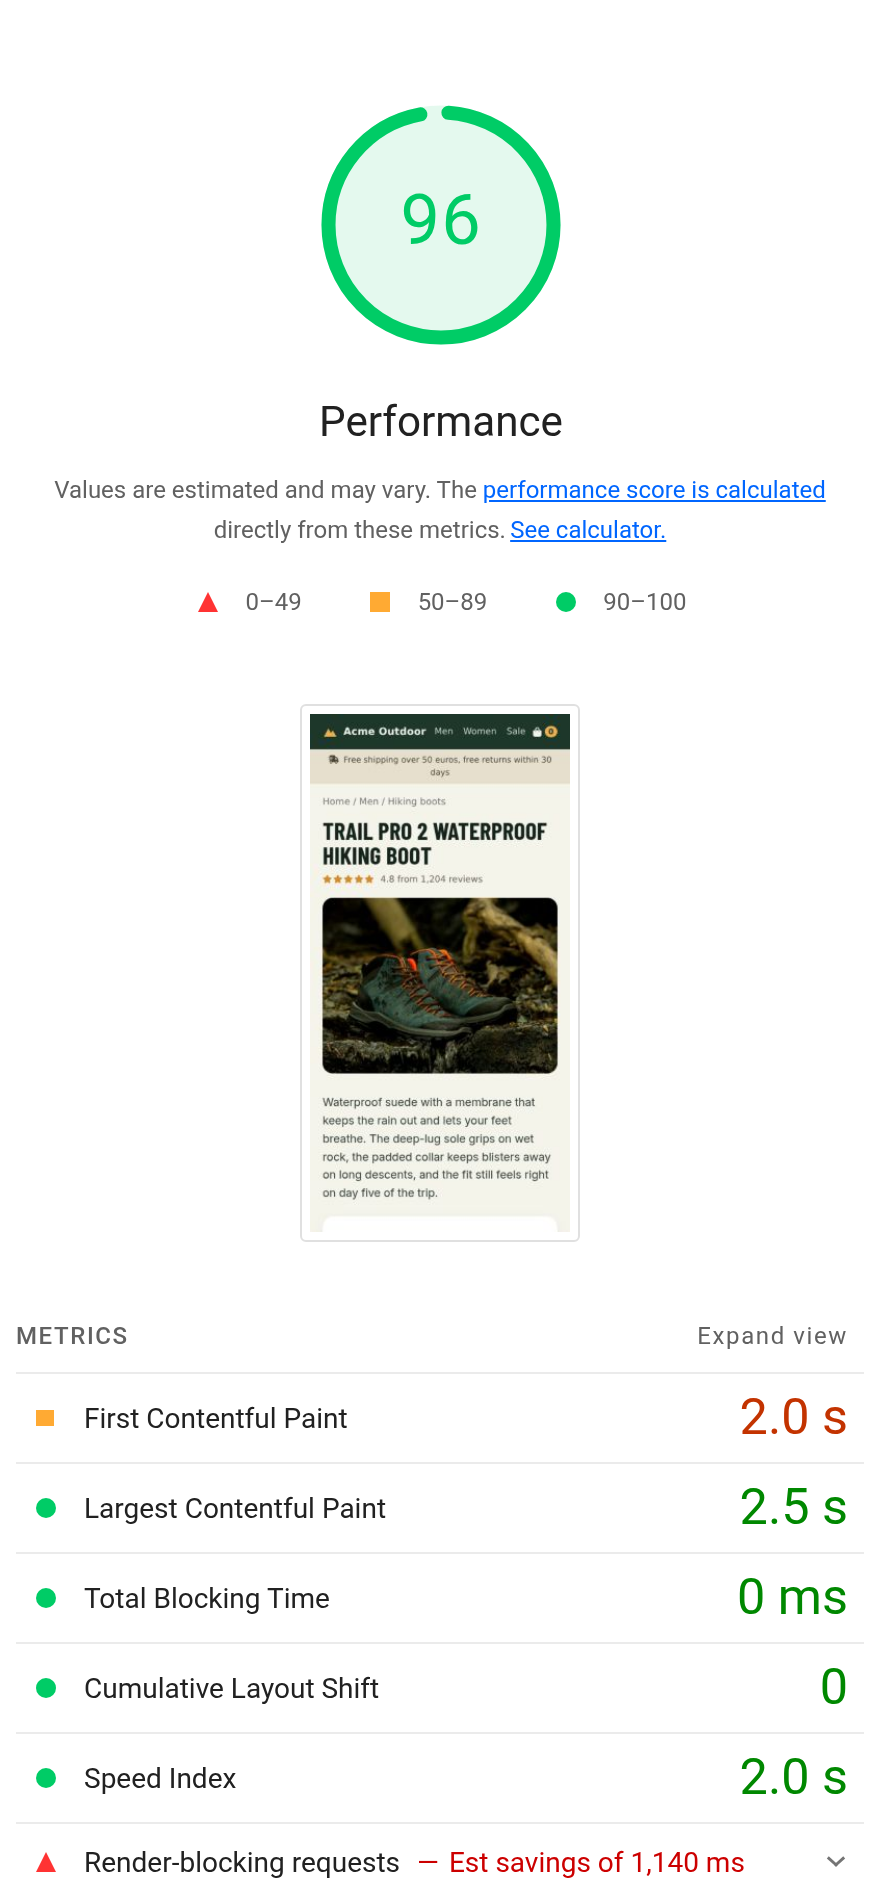
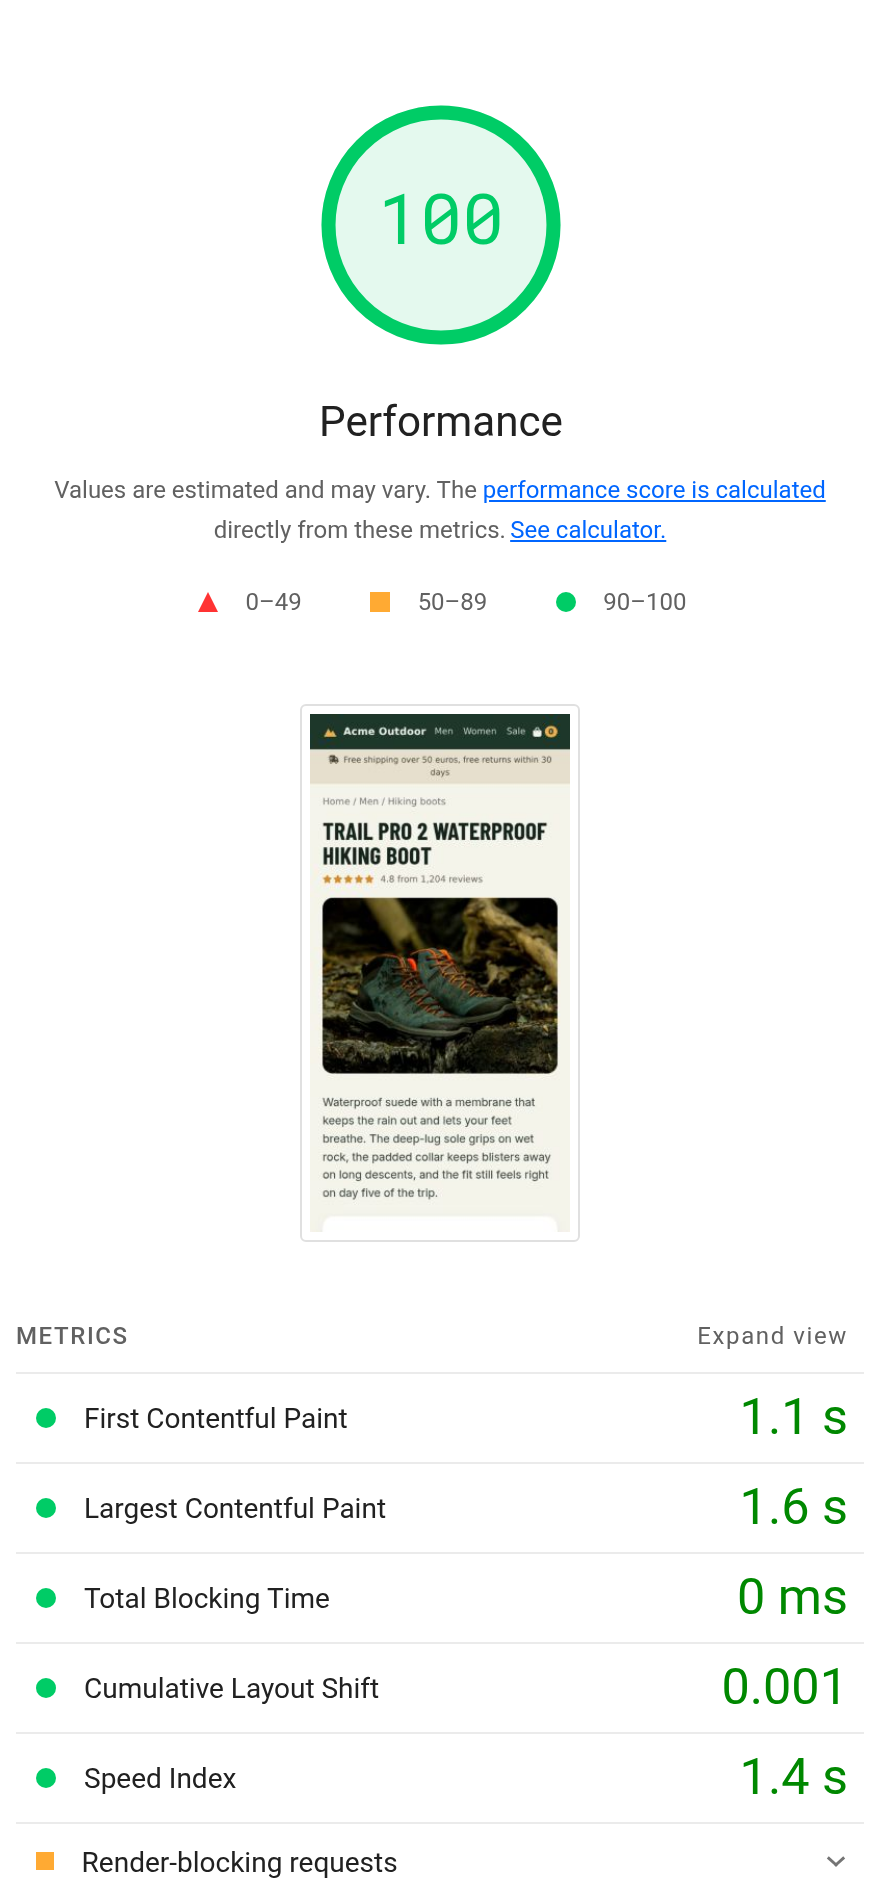
Run Lighthouse on mobile again. With the fix the score went from 96 to 100 and the simulated FCP from 2.0 s to 1.1 s, and the insight went from red with twelve files to orange with one: the 6.6 kB stylesheet.
Before
After
Lighthouse 13.5.0, mobile, simulated throttling.
Run it three times and take the middle result: on the same page the simulated FCP differed by 1.5 s between runs.
CoreDash shows FCP and LCP render delay from the next visits on. CrUX and Search Console show the last 28 days, so two weeks after the fix half of what they show is still the old site.
Want to know whether blocking CSS is what keeps your mobile FCP or LCP red? In a Core Web Vitals power hour we open your field data and a trace of your page together, and you leave with the files to trim, combine or defer.
Find out what is actually slow.
I map your critical rendering path using real field data. You get a prioritized fix list, not a Lighthouse report.
Get the audit
